
GDP is the total value of everything a country produces in a set period. It is the single number economists, central banks, and fund managers watch most closely, and it moves currencies, bond yields, and stock prices the day it is released.
This guide answers how does GDP affect the stock market in plain terms, with the math behind it, real examples from India, the United States, and other economies, and the mistakes that trip up new investors. By the end, you will know how to read a GDP report the way a professional investor does, not just what the term means.
If you are new to how markets work more broadly, our guide on how the stock market works is a useful companion to this one.
What is GDP, exactly?
Gross Domestic Product (GDP) is the market value of all final goods and services produced within a country’s borders in a given quarter or year. “Final” matters here: GDP counts the bread a bakery sells, not the flour, sugar, and labour that went into making it separately, because those inputs are already priced into the bread.
Statistical agencies calculate GDP three ways, and all three should arrive at roughly the same number:
- The expenditure approach. GDP = C + I + G + (X − M), where C is consumer spending, I is business investment, G is government spending, X is exports, and M is imports.
- The income approach. Add up wages, rents, interest, and profits earned in the economy.
- The production approach. Add up the value added at each stage of production across every industry.
The U.S. Bureau of Economic Analysis (BEA) publishes the official U.S. GDP estimates using the expenditure approach. In India, the Ministry of Statistics and Programme Implementation (MoSPI) compiles GDP using both production and expenditure methods, while the Reserve Bank of India (RBI) uses these figures to assess economic growth, inflation trends, and monetary policy decisions.
Nominal GDP vs real GDP
Nominal GDP uses current prices. Real GDP strips out inflation, so it reflects actual output growth rather than prices simply rising. A country can show 8% nominal GDP growth while real GDP grows only 4%, if inflation ran at roughly 4% that year. Markets and central banks care almost entirely about real GDP, because that is the number that reflects genuine economic expansion.
GDP growth rate
The GDP growth rate is the percentage change in real GDP from one period to the next, usually reported quarter over quarter (annualized) or year over year. India reports growth by fiscal year, running April to March. The United States reports quarterly figures at a seasonally adjusted annual rate.
Example: In its second-estimate release for Q1 FY26, the RBI projected India’s full-year real GDP growth at 7.3%, up from an earlier estimate of 6.8%, on the back of strong domestic consumption and GST rate cuts. Around the same period, U.S. real GDP for Q1 2026 was revised to 2.1% annualized growth, according to the Bureau of Economic Analysis. Two large economies, two very different growth rates, and two very different stock market reactions to that data. That contrast is the heart of this guide.
How does GDP affect the stock market?
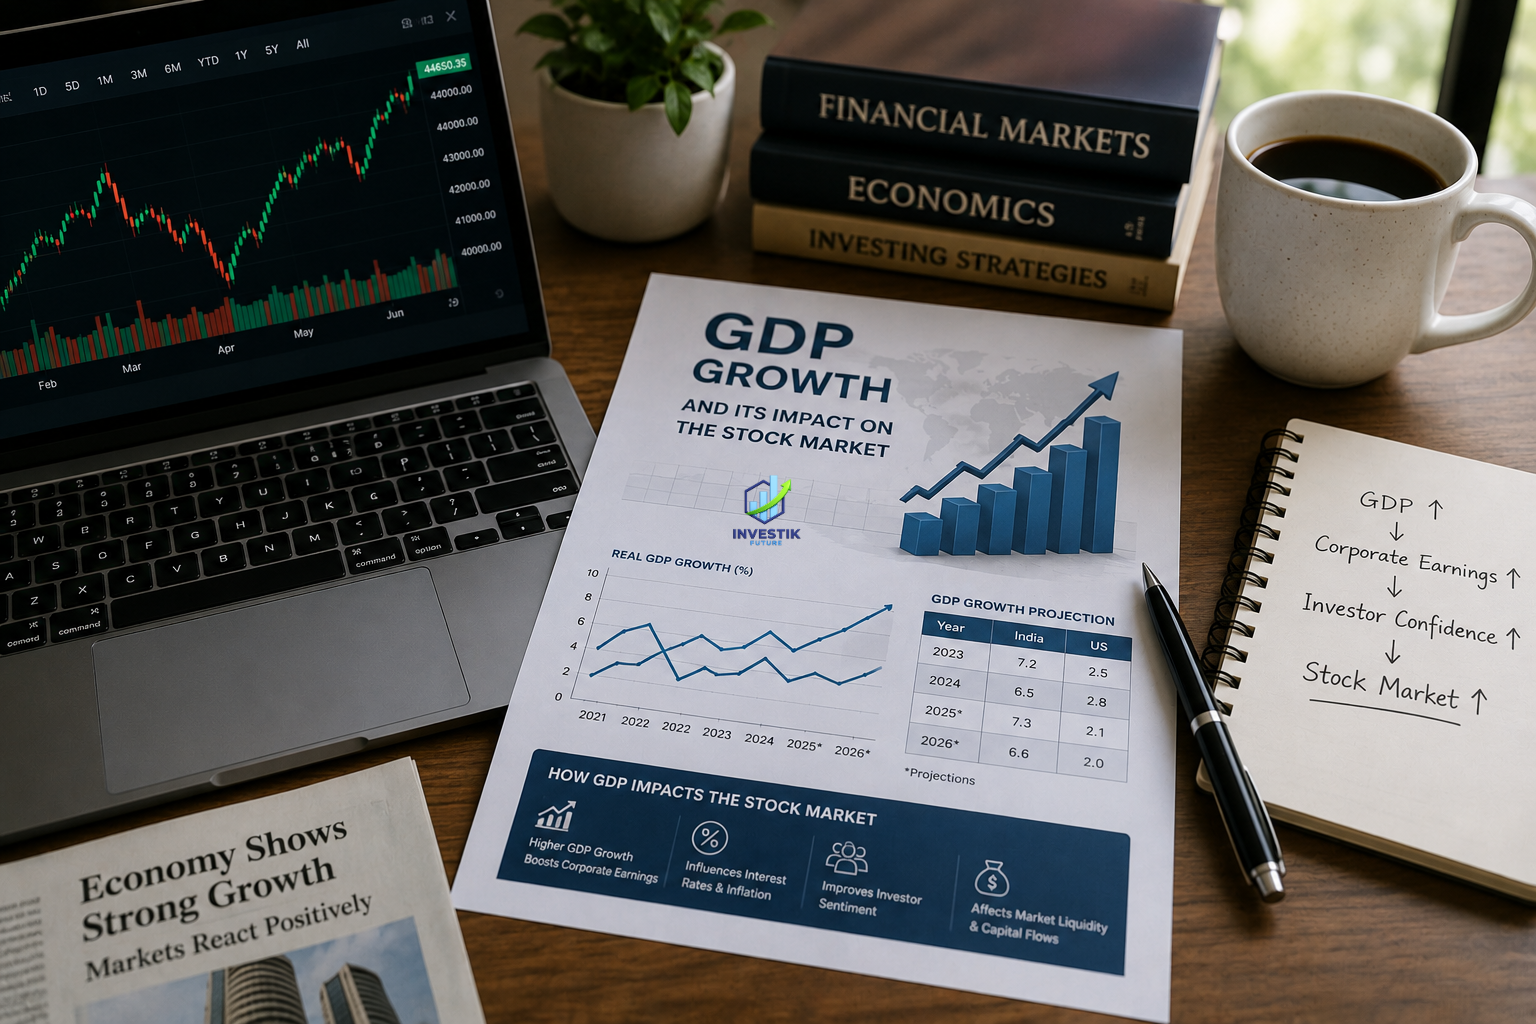
GDP does not move stock prices by itself. It works through four channels: corporate earnings, interest rate expectations, investor sentiment, and capital flows. Each one deserves its own explanation.
1. Corporate earnings follow economic output
Company revenue comes from selling goods and services to consumers, businesses, and governments, which is exactly what GDP measures in aggregate. When GDP grows, more goods move, more services get booked, and more of that spending lands on corporate income statements as revenue. Higher revenue, if margins hold, means higher earnings per share, and earnings are the single biggest driver of long-run stock prices.
This is why analysts build sector-level GDP assumptions into earnings models. A bank forecasting loan growth, or an auto company forecasting vehicle sales, starts with a GDP growth assumption and works down from there.
2. GDP shapes interest rate decisions
Central banks set policy rates partly based on how fast the economy is growing. Strong GDP growth alongside rising inflation often pushes a central bank toward higher rates, since inflation is a common side effect of an economy running hot. Higher rates raise the cost of borrowing for companies and raise the discount rate used to value future earnings, both of which tend to compress stock valuations, particularly for high-growth and high-debt companies.
Weak GDP growth usually does the opposite. It gives central banks room to cut rates or hold them steady, which lowers borrowing costs and often supports higher valuations, even while the underlying economy is soft. The RBI’s move to cut its repo rate by 25 basis points to 5.25% in December 2025, alongside upgraded growth forecasts and cooling inflation, is a clean example of this GDP-to-rates-to-markets chain in action.
3. GDP shifts investor sentiment and risk appetite
Markets are forward-looking. A GDP report is old data by the time it is published, since it covers a quarter that already ended, but investors use it to update their expectations for the next few quarters. A GDP beat can lift sentiment and pull money into cyclical sectors like banking, industrials, and consumer discretionary stocks. A miss can push investors toward defensive sectors like utilities, pharma, and consumer staples.
This is also why the stock market and the real economy can diverge for stretches of time. Markets often price in a recovery or a slowdown months before GDP data confirms it, which is why equities are sometimes called a leading indicator while GDP is a lagging one.
4. GDP influences foreign capital flows
Foreign institutional investors (FIIs) allocate capital across countries partly based on relative growth prospects. A country with strong, sustained GDP growth, manageable inflation, and a stable currency tends to attract more foreign portfolio investment into its equity markets. India’s position as one of the world’s fastest-growing major economies and a leading member of the G20, as highlighted by the World Bank and the International Monetary Fund (IMF), has consistently attracted both domestic and foreign investors. Strong economic growth often supports long-term confidence in benchmark indices such as the Nifty 50 and Sensex, although global economic conditions can still influence foreign institutional investment (FII) flows.
GDP growth rate and stock market returns: how strong is the link?
The relationship is real, but it is weaker and messier than most headlines suggest. Three things break the simple “GDP up, market up” story.
Markets price in expectations, not history. By the time a GDP figure is published, investors have already traded on months of incoming data: PMI surveys, employment numbers, corporate guidance, and commodity prices. The actual GDP print often confirms what the market priced in weeks earlier, so the stock reaction to the number itself can be small, or can even move in the opposite direction if the number misses expectations.
Composition matters more than the headline number. A country can post 6% GDP growth driven mostly by government spending, which says little about corporate profitability, versus 6% growth driven by private consumption and business investment, which usually feeds through to earnings more directly. Reading the composition of GDP, not just the headline growth rate, tells you more about likely market impact.
Different economies show different correlation strength. According to educational resources such as Investopedia and research published by the International Monetary Fund (IMF), emerging economies like India generally show a stronger long-term relationship between GDP growth and stock market performance than many developed economies. This is because Indian companies derive a larger share of their revenues from domestic economic activity, whereas multinational corporations in developed markets often depend more on global operations than on their home country’s GDP growth.
A worked example
Say a country’s real GDP grows from $28,000 to $30,000 (in comparable units) over a year, driven by a jump in consumer wealth and spending.
Percent change = (New GDP − Old GDP) / Old GDP × 100
Percent change = (30,000 − 28,000) / 28,000 × 100 = 7.14%
A 7.14% real GDP expansion, if broad-based across consumption and investment rather than a one-off government stimulus, would typically support double-digit percentage growth in aggregate corporate earnings, since earnings tend to grow faster than GDP in expansion phases due to operating leverage. That is the mechanical link analysts use when they build top-down market forecasts.
GDP vs stock market: a side-by-side comparison
| Factor | GDP | Stock Market |
|---|---|---|
| What it measures | Total output of goods and services | Collective value of publicly listed companies |
| Timing | Lagging, reported after the quarter ends | Forward-looking, prices future expectations |
| Update frequency | Quarterly or annually | Every second markets are open |
| Includes private companies | Yes | No, only listed companies |
| Affected by sentiment | Rarely | Constantly |
| Reacts to interest rates | Indirectly, over quarters | Directly, often within days |
| Best used for | Assessing economic health | Assessing company and sector value |
Why the stock market sometimes rises when GDP is falling
This is one of the most common questions investors ask, and it has a straightforward answer once you separate the two concepts.
Markets trade on the second derivative, not the level. Stocks often care more about whether a slowdown is decelerating or accelerating than about the GDP number itself. A “less bad” GDP print during a downturn can trigger a rally, because it signals the bottom may be near.
Rate cuts during weak GDP periods can boost valuations. When growth slows, central banks often cut rates to support the economy. Lower rates raise the present value of future corporate earnings, which can lift stock prices even while current-quarter GDP looks weak.
Large listed companies are not the whole economy. A country’s benchmark index is usually dominated by a handful of large, often multinational, companies. Their revenue mix can look very different from the broader domestic economy that GDP measures, especially in economies where exports or IT services carry outsized weight in the index.
Fiscal and monetary stimulus can decouple the two. Large government spending programs or central bank asset purchases can support asset prices directly, independent of underlying GDP momentum, at least for a period.
Sector-wise sensitivity to GDP
Not every sector reacts to GDP data the same way. This breakdown helps you think about portfolio positioning around the economic cycle.
High sensitivity (cyclical sectors): banking and financial services, automobiles, real estate, industrials, and capital goods. These sectors expand and contract closely with credit growth and consumer spending, both of which move with GDP.
Moderate sensitivity: information technology and export-oriented sectors, which depend more on global GDP trends (especially in the US and Europe) than on domestic GDP alone.
Low sensitivity (defensive sectors): pharmaceuticals, FMCG and consumer staples, and utilities. Demand for medicine, daily essentials, and electricity holds up in both expansions and slowdowns, which is why these sectors are often called recession-resistant.
Common mistakes investors make with GDP data
Reacting to the headline number alone. The composition, the revisions, and the forecast versus actual gap usually matter more than the raw percentage.
Ignoring the difference between nominal and real GDP. Comparing a nominal figure from one country against a real figure from another leads to false conclusions.
Assuming a straight-line relationship with the stock market. As covered above, markets are forward-looking and often move ahead of or against GDP data, especially around interest rate decisions.
Overweighting one quarter’s data. GDP figures get revised, sometimes significantly, in the weeks after the initial estimate. The U.S. releases an advance, second, and final estimate for each quarter precisely because early numbers change.
Applying developed-market logic to emerging markets, or the reverse. Correlation strength between GDP and equity returns differs meaningfully by market structure, as noted earlier.
GDP data and taxation: what Indian investors should know
GDP itself is not taxed, but it shapes the policy environment investors operate in. Government revenue targets, set partly against nominal GDP growth assumptions, influence decisions on capital gains tax rates, securities transaction tax, and sector-specific incentives announced in the Union Budget each year. Strong nominal GDP growth generally gives the government more fiscal room, which can translate into stable or investor-friendly tax policy, while weaker growth years tend to bring more revenue-focused tax measures. Investors tracking long-term capital gains tax (LTCG), short-term capital gains tax (STCG), and securities transaction tax (STT) should treat GDP trends as one input into that broader policy picture, not a direct tax driver.
For official updates on securities market regulations, investors should rely on the Securities and Exchange Board of India (SEBI). Likewise, real-time information on stock indices, trading volumes, and listed companies is best obtained from the National Stock Exchange of India (NSE), making these two sources essential references for anyone tracking the Indian stock market.
How to actually use GDP data as an investor
A practical checklist, in the order most professional analysts follow it:
- Check the growth rate against consensus expectations, not just whether it is positive or negative. A 6% print that beats a 5% forecast often matters more to markets than a 7% print that misses an 8% forecast.
- Read the composition. Look at whether consumption, investment, government spending, or net exports drove the number.
- Compare real GDP growth to nominal GDP growth to gauge underlying inflation.
- Check for revisions to the prior quarter’s data, since a downward revision can offset an otherwise strong current print.
- Match the GDP trend to sector exposure in your portfolio, tilting toward cyclicals in acceleration phases and defensives in slowdown phases.
- Watch the central bank’s reaction function alongside GDP, since the rate decision that follows often matters more to short-term stock prices than the GDP number itself.
If you are building a long-term investment plan around economic cycles rather than reacting to single data points, our SIP Calculator can help you model how disciplined, periodic investing performs across both expansion and slowdown phases, which tends to smooth out the noise of any single GDP release.
GDP indicators around the world: a quick comparison
| Country/Region | Latest real GDP growth signal | Reporting body |
|---|---|---|
| India (FY26) | RBI projection revised up to 7.3%, from an earlier 6.8% | Reserve Bank of India, Ministry of Statistics |
| United States (Q1 2026) | 2.1% annualized, third estimate | U.S. Bureau of Economic Analysis |
| Global growth outlook | Divergent paths between fast-growing emerging markets and slower-growing developed economies | World Bank, IMF |
These figures will change with every reporting cycle, which is exactly why this guide focuses on the mechanism connecting GDP to markets rather than any single quarter’s number. Bookmark the primary sources linked above if you want the latest print rather than relying on secondary summaries.
Important Terms
How does the stock market affect GDP
The relationship runs both ways. Rising stock prices create a wealth effect: investors and households holding more valuable portfolios tend to spend more, which feeds into consumption, a direct component of GDP. A strong market also makes it cheaper for companies to raise capital through IPOs and follow-on offerings, funding expansion that adds to output. A sustained crash works in reverse, denting confidence and spending.
Does the stock market represent the economy
Not fully. A benchmark index reflects the value investors place on a relatively small set of large, listed companies, many of which earn a meaningful share of revenue overseas. GDP covers every business in the economy, listed or not, including small firms, informal-sector activity, government services, and agriculture, none of which show up directly in stock prices. That gap is why the market and the economy can move in different directions for extended periods.
What percentage of GDP does the stock market represent
This is measured by the market capitalization-to-GDP ratio, often called the Buffett Indicator. It divides the combined market value of a country’s listed companies by its GDP. A ratio well above 100% can suggest a market is richly valued relative to the underlying economy, while a ratio well below 100% can suggest room for the market to grow alongside GDP, though the ratio should be read alongside earnings growth and interest rates rather than in isolation.
Why does the stock market often grow faster than GDP
Corporate earnings can grow faster than GDP for stretches of time through operating leverage, cost efficiency, share buybacks, and companies expanding into overseas markets that are not counted in domestic GDP. Stock prices also reflect expected future earnings years out, not current output, so a market can re-rate higher on improved growth expectations well before GDP itself accelerates.
How much GDP does the stock market create
The stock market itself does not directly create GDP. Its contribution to GDP comes indirectly, through the financial services sector’s own output (broking, asset management, exchange operations), through capital raised for companies that then invest and hire, and through the wealth effect on consumer spending described above.
How does US GDP data impact the Indian stock market
US GDP releases move global risk sentiment and expectations for US Federal Reserve rate decisions, both of which affect foreign institutional investment flows into emerging markets like India. A weak US GDP print that raises hopes of Fed rate cuts can boost flows into Indian equities, while a strong print that pushes US bond yields higher can pull foreign capital back toward US assets, which weighs on Indian markets in the short term.
What is GDP in the stock market context
In market commentary, “GDP” refers to the same national output figure covered throughout this guide. It appears in stock market coverage because investors use it, alongside inflation and interest rate data, to judge whether the broader economy can support current earnings expectations and valuations.
Conclusion
GDP tells you how fast an economy is growing. The stock market tells you what investors expect to happen next. The two are connected through corporate earnings, interest rates, sentiment, and capital flows, but that connection is never a straight line.
A strong GDP print can lift a market or spook it, depending on what it signals about future rate decisions. A weak print can do the same in reverse. The number that matters less is the headline growth rate. The numbers that matter more are the composition behind it, the gap between actual and expected, and how the central bank responds.
For investors, the useful habit is not predicting GDP or timing the market around a single release. It is understanding which sectors in your portfolio are cyclical and which are defensive, tracking the direction of the economic cycle over several quarters, and letting that shape allocation decisions gradually rather than reacting to one data point.
GDP data will keep changing every quarter. The framework in this guide, reading composition, watching rate policy, matching sector exposure to the cycle, holds regardless of which quarter you are reading it in.
Related reading
For a broader foundation on market fundamentals, browse our Market Fundamentals category, or start with our beginner’s guide to how the stock market works. If a term in this guide was unfamiliar, our Market Glossary covers it in plain language. You can also explore more on our Stock Market category page or visit the Investik Future homepage for our full library of investing guides.
FAQs
No. GDP is one input among many, including interest rates, corporate earnings, global capital flows, and investor sentiment. It shapes the environment stocks trade in rather than setting prices directly. For India, the Ministry of Statistics and Programme Implementation and the RBI publish official releases. For the US, the Bureau of Economic Analysis publishes advance, second, and final quarterly estimates. Both are free and public. Historically, yes, to a meaningful degree. India's equity market has a higher share of domestically focused companies relative to the US market, where large index constituents often generate significant revenue from global operations, weakening the direct link between US GDP and US stock returns. A very strong GDP print can raise fears of higher inflation and faster rate hikes, which can hurt stock valuations even though the underlying economy looks healthy. Markets are often reacting to the rate outlook implied by the data, not the growth number in isolation. There is no fixed threshold. What matters more is growth relative to expectations, and whether that growth is translating into corporate earnings growth without triggering aggressive rate hikes.Does GDP directly cause stock prices to move?
Where can I check official GDP data myself?
Is India's stock market more sensitive to GDP than the US market?
Why does the market sometimes fall on a strong GDP report?
What is a good GDP growth rate for a stock market to perform well?
ARN Disclosure: Investik Future is an AMFI-registered Mutual Fund Distributor. ARN-341107 — Verify on AMFI ↗. Himani Soni is the content author and digital marketer; the ARN registration belongs to Investik Future, not to the author personally.