
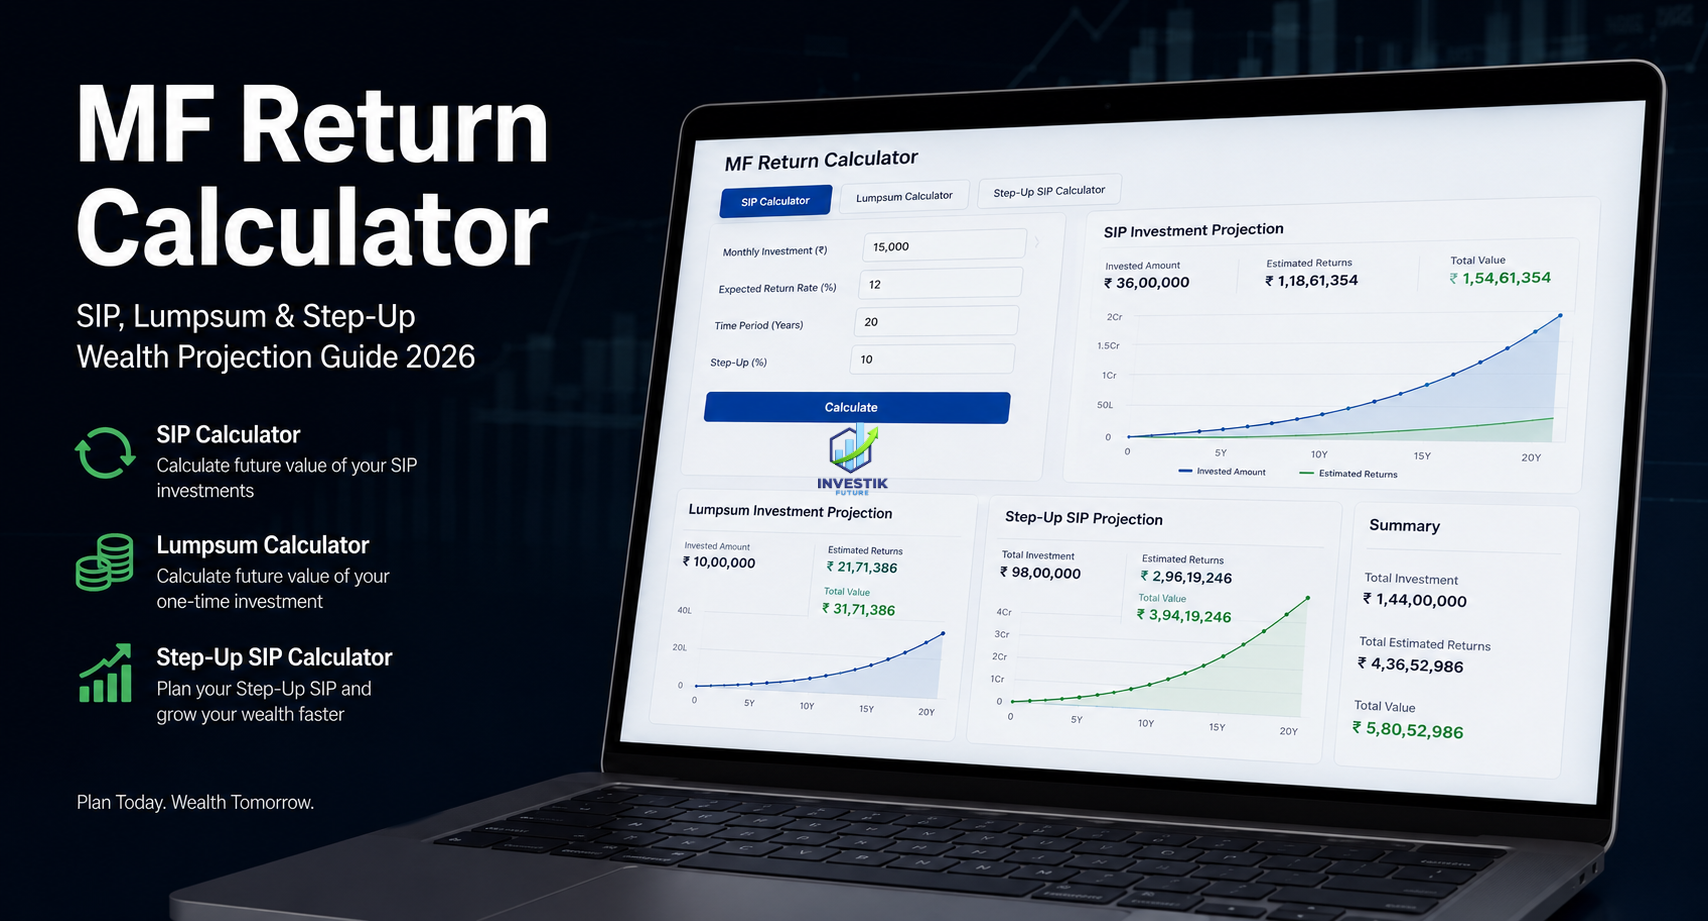

Every serious Indian investor today asks one question before committing money: “How much will my investment actually be worth?” The answer lies in using an MF Return Calculator, a simple but powerful digital tool that converts your investment assumptions into concrete wealth projections.
Whether you are planning a monthly SIP, deploying a lump-sum corpus, or exploring a step-up SIP strategy, an MF Return Calculator removes guesswork and replaces it with data. A mutual fund’s monthly returns calculator further helps investors track how their investments are performing on a month-by-month basis, though long-term planning always takes priority over short-term tracking. In this guide, we will walk you through how an MF Return Calculator works, why it matters, what the numbers actually mean in the real world, and critically, what mistakes investors make when they misread or misuse its outputs.
This is not a generic finance article. Every section here is built for the Indian investor of 2026, using the latest available data from AMFI India, SEBI, and RBI, with real scenarios, 15 projection tables, and behavioural finance insights that will change how you think about mutual fund investing.
What Is an MF Return Calculator and Why Do Investors Use It?
An MF Return Calculator is a digital tool that estimates the future value of your mutual fund investment based on three key inputs: the amount invested, the expected annual return rate, and the investment duration. It uses compounding formulas to project wealth for SIP, lump sum, and step-up SIP strategies, helping Indian investors plan goal-based portfolios with clarity.
As of April 2026, the Indian mutual fund industry’s AUM stands at ₹81.92 lakh crore. With over 27.39 crore mutual fund folios and 9.72 crore active SIP accounts contributing ₹32,087 crore per month (March 2026 data, AMFI), Indian investors are embracing mutual funds at an unprecedented scale.
Yet many investors invest without ever projecting their outcomes. The MF Return Calculator bridges that gap.
There are three primary use cases:
For SIP investors: The SIP mutual fund calculator shows how a fixed monthly investment grows over time using compound interest principles. It answers questions like: how much will ₹5,000 per month become in 10 years at 12% annualised return? A mutual fund’s monthly returns calculator complements this by showing how much the portfolio actually earns each month during the investment journey.
For lumpsum investors: The MF Return Calculator lumpsum version computes how a one-time investment grows across years using the compound growth formula. It is especially relevant for investors receiving a bonus, inheritance, or business proceeds.
For step-up SIP planners: The MF Return Calculator with step-up variant factors in an annual percentage increase in your SIP amount reflecting salary hikes, growing income, or deliberate wealth acceleration.
All three categories use the same underlying principle: the power of compounding. But the outputs are dramatically different, and that is precisely why using the right MF Return Calculator for your investment type is critical.
How Does an MF Return Calculator Work?
An MF Return Calculator applies a mathematical formula to calculate the future value of your investment. For SIP, it uses the Future Value of Annuity formula. For a lump sum, it applies the compound interest formula: FV = P × (1 + r)ⁿ. These calculators assume a constant annualised return and do not account for market volatility, making them projection tools, not guarantees.
What Formula Does an MF Return Calculator Use for SIP?
The SIP mutual fund calculator uses the Future Value of Annuity formula: FV = P × [(1 + r)ⁿ − 1] / r × (1 + r), where P is the monthly investment amount, r is the monthly return rate (annual rate ÷ 12), and n is the total number of months. This formula assumes reinvestment of returns each month, simulating the compounding effect of a regular SIP.
The key insight here is that the SIP mutual fund calculator assumes all returns are reinvested. This is the compounding engine that makes SIPs so powerful over long durations.
What Does an MF Return Calculator With Step Up Add?
An MF Return Calculator with step-up applies an annual percentage increment to your base SIP amount each year. For example, starting at ₹5,000/month with a 10% annual step-up means your contribution becomes ₹5,500 in Year 2, ₹6,050 in Year 3, and so on. This approach aligns your investment growth with your income growth and dramatically improves long-term wealth accumulation.
The MF Return Calculator with step up is arguably the most realistic SIP planning tool available because salary increments are a predictable life event for most salaried investors.
What Is an MF Return Calculator Lumpsum?
An MF Return Calculator lumpsum estimates the future value of a one-time investment using the compound interest formula: FV = P × (1 + r)ⁿ. Here, P is the lumpsum amount, r is the expected annual return rate, and n is the number of years. Unlike SIP, no additional contributions are assumed; the entire growth comes from compounding the initial corpus.
The MF Return Calculator lumpsum is particularly useful for investors who:
- Receive performance bonuses or business profits
- Inherit a sum of money
- Liquidate real estate and want to park funds in equity mutual funds
- Have accumulated a large amount and are planning a systematic withdrawal later
While the MF Return Calculator lumpsum shows the long-term projected value, a mutual fund’s monthly returns calculator can be used in parallel to monitor how the invested corpus is compounding each month against projections.
How Does the MF Return Calculator Lumpsum Compare to SIP Over 10 Years?
The MF Return Calculator lumpsum shows significantly larger absolute wealth creation compared to a SIP of the same total investment, because the entire corpus is compounding from Day 1. However, lumpsum investing carries higher timing risk; if markets fall shortly after investment, the impact is immediate and large. The SIP mutual fund calculator, by contrast, benefits from rupee cost averaging, which reduces average cost during market dips.
Table 1: MF Return Calculator Lumpsum Growth at Various Return Rates
| Lumpsum Amount | Expected Return | 5 Years | 10 Years | 15 Years | 20 Years |
|---|---|---|---|---|---|
| ₹1,00,000 | 10% p.a. | ₹1,61,051 | ₹2,59,374 | ₹4,17,725 | ₹6,72,750 |
| ₹1,00,000 | 12% p.a. | ₹1,76,234 | ₹3,10,585 | ₹5,47,357 | ₹9,64,629 |
| ₹5,00,000 | 12% p.a. | ₹8,81,170 | ₹15,52,924 | ₹27,36,784 | ₹48,23,146 |
| ₹10,00,000 | 12% p.a. | ₹17,62,342 | ₹31,05,848 | ₹54,73,566 | ₹96,46,293 |
| ₹10,00,000 | 15% p.a. | ₹20,11,357 | ₹40,45,558 | ₹81,37,059 | ₹1,63,66,537 |
Note: Returns are assumed constant for illustration. Actual mutual fund returns vary based on market conditions. Data sourced from standard compound interest formulas; assumptions stated. Not guaranteed returns.
Investor Takeaway: The MF Return Calculator lumpsum reveals the dramatic impact of two variables: time and rate of return. A single rupee invested at 15% for 20 years grows to ₹16.37, over 16× the original amount. This is why long investment horizons combined with even modest return differences produce life-changing wealth gaps.
Behavioural Insight: Most investors underestimate the impact of the rate difference between 10% and 15% over 20 years. The MF Return Calculator lumpsum makes this visible: a ₹10 lakh investment at 10% becomes ₹67.27 lakh in 20 years, while the same investment at 15% becomes ₹1.64 crore. That is a 2.4× difference purely from a 5% difference in annualised return.
What Is an MF Return Calculator With Step Up?
An MF Return Calculator with step-up calculates the compounded future value of a SIP that increases by a fixed percentage each year. It reflects the reality that most investors can afford to invest more as their income rises. A 10–15% annual step-up applied to a base SIP of ₹5,000 or ₹10,000 can more than double the final corpus compared to a flat SIP of the same starting amount.
The MF Return Calculator with step up is the most powerful form of SIP planning available. It embeds income growth into your investment strategy, making it both realistic and aspirational.
How Does MF Return Calculator With Step Up Improve Long-Term Wealth?
Using the MF Return Calculator with step up shows that even a modest 10% annual increase in SIP amount results in a corpus 35–60% larger than a flat SIP over 15–20 years. The step-up effect compounds both the principal growth and the contribution growth simultaneously, creating what financial planners call a “double compounding engine” for wealth creation.
Table 2: MF Return Calculator With Step Up, ₹5,000 Base SIP at 12% Return
| Step-Up % | 5 Years | 10 Years | 15 Years | 20 Years |
|---|---|---|---|---|
| 0% (Flat SIP) | ₹4.08 L | ₹11.62 L | ₹25.02 L | ₹49.96 L |
| 5% Annual Step-Up | ₹4.47 L | ₹14.24 L | ₹33.73 L | ₹74.62 L |
| 10% Annual Step-Up | ₹4.89 L | ₹17.43 L | ₹45.49 L | ₹1,11.72 L |
| 15% Annual Step-Up | ₹5.35 L | ₹21.31 L | ₹61.44 L | ₹1,67.65 L |
Assumptions: 12% annualised return, monthly compounding, SIP on the 1st of every month. Figures are approximate. Not guaranteed returns.
Investor Takeaway: The MF Return Calculator with step up demonstrates one of the most underutilised strategies in Indian retail investing. A ₹5,000 SIP with a 10% annual step-up at 12% return becomes ₹1.12 crore in 20 years versus just ₹49.96 lakh for a flat SIP. The step-up investor builds 2.2× more wealth with the same starting amount and a very achievable annual increase.
Behavioural Insight: Most investors resist step-up SIPs because increasing contributions feels uncomfortable. But the MF Return Calculator with step-up shows you do not need a dramatic salary hike to make step-ups work. A 10% annual SIP increase, equivalent to redirecting part of a typical annual salary increment, transforms long-term wealth creation outcomes entirely.
How Does a SIP Mutual Fund Calculator Estimate Wealth Creation?
A SIP mutual fund calculator converts your monthly investment commitment into a projected wealth number using the compound annuity formula. It is the most-used financial planning tool among Indian retail investors, enabling goal-setting for education, home purchase, retirement, and emergency corpus creation, all from a single monthly SIP amount.
The SIP mutual fund calculator is not just a mathematical tool. It is a behavioural anchor. When investors visualise how ₹5,000 per month grows to ₹1 crore over 20 years, they are far less likely to stop their SIPs during market corrections.
What Does a SIP Mutual Fund Calculator Show for Different Monthly Amounts?
The SIP mutual fund calculator shows that small differences in monthly SIP amounts lead to massive wealth divergences over 15–20 years. Increasing your SIP by just ₹2,000/month can add ₹25–40 lakh to your final corpus over a 20-year horizon at 12% return, making even marginal increases in monthly commitment highly impactful for long-term wealth.
Use our SIP Calculator to run your own projections in seconds. For tracking month-by-month portfolio growth, a mutual fund’s monthly returns calculator is your best companion alongside long-term planning tools.
Table 3: SIP Mutual Fund Calculator, ₹5,000 Monthly SIP Projections
| Return Rate | 5 Years | 10 Years | 15 Years | 20 Years | Total Invested |
|---|---|---|---|---|---|
| 8% p.a. | ₹3.67 L | ₹9.19 L | ₹17.42 L | ₹29.65 L | ₹12 L |
| 10% p.a. | ₹3.87 L | ₹10.33 L | ₹20.98 L | ₹38.28 L | ₹12 L |
| 12% p.a. | ₹4.08 L | ₹11.62 L | ₹25.02 L | ₹49.96 L | ₹12 L |
| 15% p.a. | ₹4.42 L | ₹13.93 L | ₹33.49 L | ₹75.79 L | ₹12 L |
Assumptions: SIP starting on the 1st of the month, monthly compounding, returns constant throughout. Not guaranteed.
Table 4: SIP Mutual Fund Calculator, ₹10,000 Monthly SIP Projections
| Return Rate | 5 Years | 10 Years | 15 Years | 20 Years | Total Invested |
|---|---|---|---|---|---|
| 8% p.a. | ₹7.34 L | ₹18.38 L | ₹34.84 L | ₹59.30 L | ₹24 L |
| 10% p.a. | ₹7.74 L | ₹20.66 L | ₹41.97 L | ₹76.57 L | ₹24 L |
| 12% p.a. | ₹8.17 L | ₹23.23 L | ₹50.04 L | ₹99.92 L | ₹24 L |
| 15% p.a. | ₹8.84 L | ₹27.87 L | ₹66.97 L | ₹1,51.58 L | ₹24 L |
Assumptions: Same as above. Figures rounded to two decimal places in lakhs.
Table 5: Monthly SIP Growth Projection, ₹5,000 at 12% Return
The mutual fund’s monthly returns calculator helps investors see this month-by-month progression, making it easier to stay the course during slow early years.
| Year | Cumulative Investment | Projected Value | Wealth Gain |
|---|---|---|---|
| 1 | ₹60,000 | ₹63,948 | ₹3,948 |
| 3 | ₹1,80,000 | ₹2,15,520 | ₹35,520 |
| 5 | ₹3,00,000 | ₹4,08,348 | ₹1,08,348 |
| 7 | ₹4,20,000 | ₹6,62,556 | ₹2,42,556 |
| 10 | ₹6,00,000 | ₹11,61,695 | ₹5,61,695 |
| 15 | ₹9,00,000 | ₹25,02,277 | ₹16,02,277 |
| 20 | ₹12,00,000 | ₹49,95,742 | ₹37,95,742 |
Investor Takeaway: At 12% return, ₹5,000 invested monthly for 20 years grows to nearly ₹50 lakh, generating ₹37.96 lakh of wealth gain on ₹12 lakh of capital invested. That is a 3.16× wealth multiplier purely from compounding.
What Can Mutual Fund Returns 10 Years Teach Investors?
Historical mutual fund returns over 10 years in India show that disciplined equity mutual fund SIPs have delivered annualised returns of approximately 11–16% across most market cycles. However, mutual fund returns 10 years of data also reveal significant variance; some funds delivered 8%, others 18%, underscoring the importance of fund selection, category choice, and investment consistency over return-chasing.
Understanding real mutual fund returns for the past 10 years of data is essential before feeding assumptions into any MF Return Calculator. Over-optimistic inputs lead to unrealistic plans. Under-conservative inputs lead to under-saving. A mutual fund’s monthly returns calculator can additionally help investors reconcile their monthly portfolio statements against projected benchmarks, keeping them aware of any persistent underperformance that might warrant a fund switch.
What Do Mutual Fund Returns 10 Years Look Like Across Categories?
Mutual fund returns 10 years data (as of 2026) show that large-cap equity funds have typically delivered 10–13% annualised returns, mid-cap funds 13–17%, and small-cap funds 14–18%, but with proportionally higher volatility. Debt mutual fund returns over 10 years have ranged from 6–8%, while hybrid funds have delivered 9–12%, serving as a middle ground for moderate-risk investors.
Note: Historical data is indicative. Past performance does not guarantee future returns. Always verify fund-level data at the SEBI SCORES portal or AMFI India.
Table 6: Mutual Fund Returns 10 Years, Category-Wise Indicative Annualised Returns (2016–2026)
| Fund Category | 3-Year Return | 5-Year Return | 10-Year Return | Risk Level |
|---|---|---|---|---|
| Large-Cap Equity | 10–13% | 11–14% | 10–13% | Moderate |
| Flexi-Cap Equity | 12–16% | 13–17% | 12–16% | Moderate-High |
| Mid-Cap Equity | 14–18% | 15–19% | 13–17% | High |
| Small-Cap Equity | 14–20% | 16–22% | 14–18% | Very High |
| Hybrid Balanced | 9–12% | 10–13% | 9–12% | Moderate |
| Debt (Short Term) | 6–8% | 6–8% | 6–8% | Low |
| ELSS (Tax-Saving) | 12–16% | 12–16% | 11–14% | Moderate-High |
Data is indicative based on category averages. Verify current fund performance at AMFI India. Past performance is not a guarantee of future results.
Investor Takeaway: When using an MF Return Calculator, the assumed return rate is your most critical and most uncertain input. Using 12% for equity-oriented funds is a reasonable middle-ground assumption for long-term projections, but setting your plan around 15% without a margin of safety is speculative. Always run your MF Return Calculator at 3 return scenarios: 8%, 12%, and 15% to understand the range of outcomes.
SIP vs Lumpsum Using MF Return Calculator Analysis
Using an MF Return Calculator to compare SIP vs lumpsum investing reveals that both strategies create wealth, but through different mechanisms. Lumpsum investing benefits when deployed in undervalued markets; the entire corpus compounds from Day 1. SIP investing via a SIP mutual fund calculator works best in volatile or overvalued markets, as rupee cost averaging reduces the impact of market timing errors.
Neither approach is universally superior. The MF Return Calculator lets you model both sides and choose based on your risk profile, cash flow situation, and market conditions.
Table 7: SIP vs Lumpsum Comparison, ₹12 Lakh Total Investment at 12% Return
| Investment Mode | Amount | Duration | Projected Value | Wealth Gain |
|---|---|---|---|---|
| Lumpsum (Day 1) | ₹12,00,000 | 10 Years | ₹37,27,017 | ₹25,27,017 |
| SIP ₹10,000/month | ₹12,00,000 | 10 Years | ₹23,23,391 | ₹11,23,391 |
| Lumpsum (Day 1) | ₹12,00,000 | 20 Years | ₹1,15,75,630 | ₹1,03,75,630 |
| SIP ₹5,000/month | ₹12,00,000 | 20 Years | ₹49,95,742 | ₹37,95,742 |
Assumptions: Constant 12% annual return, no withdrawals. Lumpsum invested on Day 1.
Investor Takeaway: The lumpsum approach builds substantially more wealth when the full amount is available upfront, and returns are consistent. However, in practice, most investors do not have ₹12 lakh available as a lumpsum on the same day. The SIP mutual fund calculator makes small, consistent investments feasible and removes the dangerous temptation of market timing.
Table 8: Step-Up SIP vs Normal SIP, ₹5,000 Base at 12% Return over 20 Years
| Strategy | Starting SIP | Step-Up % | Total Invested | Projected Corpus |
|---|---|---|---|---|
| Flat SIP | ₹5,000/month | 0% | ₹12,00,000 | ₹49,95,742 |
| 5% Step-Up SIP | ₹5,000/month | 5%/year | ₹19,83,190 | ₹74,62,000 |
| 10% Step-Up SIP | ₹5,000/month | 10%/year | ₹34,36,450 | ₹1,11,72,000 |
| 15% Step-Up SIP | ₹5,000/month | 15%/year | ₹62,32,100 | ₹1,67,65,000 |
Approximate figures. The MF Return Calculator with step-up assumes an annual increment applied at the start of each year.
Inflation-Adjusted Returns and Tax Impact on MF Return Calculator Projections
An MF Return Calculator typically shows nominal returns, not adjusted for inflation or taxes. Inflation at 5–6% per year significantly erodes the purchasing power of projected corpus values. Similarly, equity fund gains are subject to Long-Term Capital Gains (LTCG) tax at 12.5% on gains above ₹1.25 lakh per year. A comprehensive MF Return Calculator must account for both to give investors a realistic picture of post-tax, inflation-adjusted wealth.
Table 9: Inflation-Adjusted Return, ₹5,000 SIP at 12% Return vs 6% Inflation
| Duration | Nominal Value | Real Value (Inflation Adjusted @ 6%) | Purchasing Power Loss |
|---|---|---|---|
| 5 Years | ₹4,08,348 | ₹3,05,109 | ₹1,03,239 |
| 10 Years | ₹11,61,695 | ₹6,48,620 | ₹5,13,075 |
| 15 Years | ₹25,02,277 | ₹10,44,256 | ₹14,58,021 |
| 20 Years | ₹49,95,742 | ₹15,59,346 | ₹34,36,396 |
Inflation adjustment uses 6% as an assumption. Real-world inflation may vary.
Table 10: Taxation Comparison, Equity vs Debt Mutual Fund Returns
| Fund Type | Holding Period | Tax Rate | LTCG Exemption | Effective Tax |
|---|---|---|---|---|
| Equity MF | < 1 year | 20% STCG | Nil | 20% on full gain |
| Equity MF | > 1 year | 12.5% LTCG | ₹1.25 lakh/year | 12.5% above the exemption |
| Debt MF | Any duration | As per the slab | Nil | Per the income tax slab |
| ELSS | > 3 years (lock-in) | 12.5% LTCG | ₹1.25 lakh/year | 12.5% above the exemption |
Tax rates as per the Finance Act applicable for FY 2025-26. Verify current rates at Income Tax India and SEBI. Tax laws are subject to change.
Investor Takeaway: When using an MF Return Calculator, always run a post-tax scenario. For a long-term equity SIP investor with ₹49.96 lakh corpus (20 years, ₹5,000/month at 12%), the actual taxable LTCG would be approximately ₹37.96 lakh (gains). With the ₹1.25 lakh annual exemption utilised strategically through systematic withdrawal, effective tax liability can be significantly optimised.
Retirement and Goal-Based Planning Using MF Return Calculator
The MF Return Calculator is the foundational tool for retirement corpus planning. Indian investors typically need 25–30× their annual expenses as a retirement corpus to sustain a 4–5% annual withdrawal rate (SWP) indefinitely. The MF Return Calculator helps reverse-engineer the monthly SIP required to reach this target corpus based on years to retirement and expected return.
Table 11: Retirement Corpus Projection, Monthly SIP Required at 12% Return
| Target Corpus | Years to Retirement | Required Monthly SIP (12%) | Required Monthly SIP (10%) |
|---|---|---|---|
| ₹1 Crore | 20 Years | ₹10,011/month | ₹13,070/month |
| ₹1 Crore | 25 Years | ₹5,322/month | ₹7,528/month |
| ₹2 Crore | 20 Years | ₹20,022/month | ₹26,140/month |
| ₹2 Crore | 25 Years | ₹10,644/month | ₹15,056/month |
| ₹5 Crore | 25 Years | ₹26,610/month | ₹37,640/month |
| ₹5 Crore | 30 Years | ₹14,193/month | ₹21,574/month |
The MF Return Calculator makes this reverse engineering straightforward. Investors should start early to keep monthly requirements manageable.
Table 12: SWP vs SIP, Comparison for Retirement Phase Planning
| Feature | SIP (Accumulation) | SWP (Withdrawal) |
|---|---|---|
| Purpose | Build corpus | Draw income from the corpus |
| Cash flow direction | Into the fund | Out of the fund |
| Tax relevance | Capital gains on redemption | LTCG on each withdrawal |
| Best use | Working years | Retirement years |
| Calculator tool | SIP mutual fund calculator | SWP calculator |
| Risk | Returns may fall short | Corpus depletion risk |
Table 13: Goal-Based Investing Examples Using MF Return Calculator
| Goal | Target Amount | Time Horizon | Required SIP (12%) | Strategy |
|---|---|---|---|---|
| Child’s higher education | ₹30 Lakhs | 15 Years | ₹5,998/month | Equity SIP + Step-Up |
| Dream home down payment | ₹20 Lakhs | 7 Years | ₹17,325/month | Balanced hybrid SIP |
| Retirement corpus | ₹2 Crore | 25 Years | ₹10,644/month | Flexi-cap + step-up |
| Foreign vacation fund | ₹5 Lakhs | 3 Years | ₹13,067/month | Short-term debt fund |
| Emergency corpus (6 months) | ₹3 Lakhs | 2 Years | ₹11,447/month | Liquid/Overnight fund |
Use our Wealth Bachat Formula guide to build a complete goal-based framework.
Risk vs Return Understanding in MF Return Calculator Projections
An MF Return Calculator shows return projections, not risk profiles. The higher the assumed annual return, the higher the underlying market risk. Indian investors must match their expected return assumption to their actual risk tolerance; using 15% return assumptions for conservative investors leads to dangerous over-confidence and under-preparation when markets underperform.
Table 14: Risk vs Return Comparison, Mutual Fund Category Analysis
| Risk Category | Typical Fund Type | Expected Return Range | Recommended For |
|---|---|---|---|
| Low | Liquid, Overnight Debt | 6–7% | Emergency funds, < 1 year |
| Low-Moderate | Short-Duration Debt | 6–8% | 1–3 year goals |
| Moderate | Hybrid Balanced | 9–12% | 3–5 year goals, moderate risk |
| Moderate-High | Flexi-Cap, Large-Cap | 10–14% | 5–10 year goals |
| High | Mid-Cap, Small-Cap | 12–18% | 10+ year goals, high risk tolerance |
| Very High | Sectoral/Thematic | 10–25% | Tactical, high knowledge needed |
Data is indicative. Verify fund-level disclosures at SEBI SCORES and fund offer documents.
Table 15: Mutual Fund’s Monthly Returns, Illustrative Category Returns (Indicative)
Use a mutual fund’s monthly returns calculator to benchmark your actual portfolio’s monthly NAV changes against these category averages. If your equity fund consistently underperforms its category by more than 3–4% per month over 12 consecutive months, a portfolio review is warranted.
| Category | Jan 2026 | Feb 2026 | Mar 2026 | Annualised (Indicative) |
|---|---|---|---|---|
| Large-Cap Equity | -1.8% | -2.1% | -3.5% | 10–12% (10-yr avg) |
| Mid-Cap Equity | -2.4% | -2.9% | -4.1% | 13–17% (10-yr avg) |
| Small-Cap Equity | -3.1% | -3.5% | -5.2% | 14–18% (10-yr avg) |
| Hybrid Balanced | -1.1% | -1.5% | -2.2% | 9–12% (10-yr avg) |
| Debt Short Duration | +0.5% | +0.4% | +0.6% | 6–8% (5-yr avg) |
Short-term monthly returns can be negative even in high-performing funds. The mutual fund’s monthly returns calculator concept requires a long-term perspective; monthly figures should never be used to judge SIP performance.
Investor Takeaway: A mutual fund’s monthly returns calculator is best used for fund monitoring, not for SIP performance evaluation. Monthly return volatility is expected and normal in equity funds. The true evaluation of your MF Return Calculator projection should happen over 3–5-year rolling periods, not month-by-month.
What Is SBI MF Return Calculator and How Does It Differ?
The SBI MF Return Calculator is a fund-specific tool offered on the SBI Mutual Fund platform that allows investors to calculate projected returns specifically from SBI Mutual Fund schemes. It functions identically to a standard MF Return Calculator using the same compound formula, but pre-populates fund categories and scheme names from SBI MF’s product range for added convenience.
The SBI MF Return Calculator is useful for investors who are specifically invested in SBI Mutual Fund schemes and want to project returns using scheme-specific historical NAV data. However, the underlying projection methodology, compounding at an assumed rate, is the same as any standard MF Return Calculator.
For broader planning across fund houses, using a generalised MF Return Calculator like the one available on Investik Future with your own assumed return rate gives you more flexibility and control.
Common Mistakes Investors Make While Using MF Return Calculator Tools
The most dangerous mistake investors make with an MF Return Calculator is assuming that projected returns are guaranteed returns. They are not. Calculators use a constant assumed rate, whereas real markets deliver variable, volatile, and sometimes negative returns. Additional errors include using overly optimistic return assumptions, ignoring inflation, neglecting taxes, and abandoning SIPs when actual returns temporarily fall below projected values.
Here are the five most common and costly errors:
Mistake 1: Assuming 15–18% Returns for All Time Periods. The MF Return Calculator allows any return input. But equity mutual funds have historically delivered 12–14% over 15+ year periods, not 18% consistently. Plugging in 18% leads investors to believe they need to save less than they actually do.
Mistake 2: Ignoring Inflation When Reading Output. A ₹50 lakh corpus in 2046 is not the same as ₹50 lakh today. Using an MF Return Calculator without inflation adjustment creates a false sense of security. Always run the inflation-adjusted scenario.
Mistake 3: Stopping SIPs During Market Corrections. The SIP mutual fund calculator assumes uninterrupted investment. Investors who pause SIPs during corrections break the compounding cycle at precisely the wrong time, when units are cheapest. Read our full SIP guide to understand why continuation is critical.
Mistake 4: Not Using Step-Up SIP. Flat SIP projections are consistently less powerful than the MF Return Calculator with step-up projections. Many investors leave substantial wealth on the table simply because they never increase their SIP amount, even as their income grows.
Mistake 5: Comparing Different Fund Types Using the Same Return Rate. Using 12% as the assumed rate for both a liquid fund and an equity mid-cap fund in an MF Return Calculator produces equally wrong outputs. Return assumptions must match the fund category’s realistic historical range.
Behavioural Finance Lessons from MF Return Calculator Projections
The MF Return Calculator does more than compute numbers; it reveals psychological traps that undermine investor outcomes. Behavioural finance research consistently shows that investors overestimate returns, underestimate time requirements, and react emotionally to short-term losses in ways that destroy the very wealth the calculator projects.
This is the section most financial calculators skip, and the most important section for real wealth creation.
Why Investors Overestimate Returns
Recency bias causes investors to assume that recent bull market performance will continue indefinitely. An investor who sees a mid-cap fund’s return of 25–30% in 2023 enters the MF Return Calculator with 20% assumptions. When actual returns revert to the 12–15% long-term average, they feel cheated and often exit, converting a temporary underperformance into a permanent loss.
The mutual fund guide at Investik Future explains in detail why realistic return expectations are the foundation of any solid investment plan.
Why Unrealistic Expectations Hurt Investing
When the MF Return Calculator shows ₹1 crore at 15% return but actual returns come in at 11%, the investor feels the fund “failed.” In reality, 11% over 20 years is an extraordinary outcome. This expectation gap causes premature exits at exactly the wrong moments, often just before a recovery phase.
Why Compounding Needs Time
The SIP mutual fund calculator output often shows slow growth in Years 1–7 and explosive growth in Years 15–20. This back-loading of returns is mathematically correct. But behaviourally, investors get impatient in the “slow phase” and exit before the exponential phase begins. The MF Return Calculator user must mentally commit to the full timeline, not just the final number.
Why Investors Stop SIPs Too Early
AMFI data for March 2026 shows the monthly SIP stoppage ratio reached approximately 76%, the highest typically recorded each year during the financial year-end. While many of these are planned (ELSS lock-in completions, mandate expirations), a significant portion represents investors who voluntarily stop due to market anxiety or lifestyle inflation.
The cost is enormous. Stopping a ₹10,000 SIP at Year 7 instead of Year 20 at 12% return means giving up ₹76.69 lakh in projected corpus (₹23.23 lakh at Year 10 grows to ₹99.92 lakh at Year 20; the final 10 years add ₹76.69 lakh).
Why Step-Up SIP Improves Outcomes (Behaviourally)
The MF Return Calculator with step-up forces investors to commit to a rising contribution plan. This pre-commitment strategy, well-documented in behavioural economics (“Save More Tomorrow” by Thaler & Benartzi), dramatically improves savings rates because the increase is felt less acutely when attached to a future income event (salary hike) rather than an immediate sacrifice.
Why Long-Term Discipline Beats Prediction
No investor can consistently time the market. The MF Return Calculator is a planning tool, not a prediction tool. Investors who commit to a plan, with a fixed SIP, with annual step-up, for 15–20 years consistently outperform those who try to time entry and exit points. The calculator gives you the destination. Discipline provides the journey.
For a comprehensive framework on building and maintaining investment discipline, explore the Position Size Calculator and Stock Average Calculator tools on Investik Future.
Investik Future Final Verdict on MF Return Calculator
The MF Return Calculator is the single most important financial planning tool for Indian retail investors. It converts abstract goals into concrete monthly SIP amounts, reveals the true power of compounding, and, when used correctly, builds the psychological conviction needed to stay invested for 15–20 years. Every investor- SIP, lump sum, step-up, or retirement planner- should use an MF Return Calculator as the foundation of their wealth strategy.
Here is who should use which version:
SIP investors should use the SIP mutual fund calculator to project wealth at different monthly amounts and time horizons. Start with a 12% return assumption for equity funds. Always run a 10% scenario for conservative planning.
Lump sum investors should use the MF Return Calculator lumpsum to compare returns across different durations. Consider staggering the lump sum over 6–12 months using a Systematic Transfer Plan (STP) if deploying during high valuations.
Step-Up SIP planners should use the MF Return Calculator with step up to discover the dramatic long-term benefit of annual SIP increases. Even a 10% annual increment substantially compounds wealth over 15–20 years.
Retirement planners should reverse-engineer their corpus target using the MF Return Calculator, knowing how much monthly SIP is needed to reach ₹1, ₹2, or ₹5 crore in 20–30 years is a critical planning input.
Goal-based investors should run goal-specific scenarios for a child’s education, home down payment, and wedding fund, each with its own timeline, risk profile, and return assumption. Pair the MF Return Calculator with a mutual fund’s monthly returns calculator to track both the long-term plan and short-term progress simultaneously.
The most important caveat: an MF Return Calculator produces projections, not promises. Markets deliver variable returns. Discipline, diversification, and periodic portfolio review remain indispensable.
Start with Investik Future’s SIP Calculator, explore the full SIP guide and mutual fund guide, and build your wealth plan today at Investik Future.
Read More From Investik Future
- What Is SIP? Full Form, Benefits & How SIP Works, Complete Guide
- What Is a Mutual Fund? Wealth Building Secrets Every Investor Must Know
- SIP Calculator: Calculate Your SIP Returns Instantly
- Position Size Calculator: Manage Risk Like a Pro
- Wealth Bachat Formula: The Smart Way to Save and Invest
Most Asked Terms
What is an MF Return Calculator lumpsum?
The MF Return Calculator lumpsum variant estimates how a one-time investment grows over time through compounding. It is ideal for investors receiving a bonus, inheritance, or business proceeds who want to project wealth from a single upfront investment rather than monthly contributions.
What is an MF Return Calculator with step up?
The MF Return Calculator with step up calculates returns where your SIP amount increases by a fixed percentage each year. A 10% annual step-up on a ₹5,000 base SIP results in ₹5,500 in Year 2, ₹6,050 in Year 3, and so on, producing a significantly higher long-term corpus than a flat SIP.
How much can ₹5,000 SIP grow in 10 and 20 years?
At 12% annualised return, a ₹5,000 SIP grows to approximately ₹11.62 lakh in 10 years and ₹49.96 lakh in 20 years on a total investment of ₹6 lakh and ₹12 lakh, respectively. The SIP mutual fund calculator makes this projection instantly visible.
What are typical mutual fund returns over 10 years in India?
Mutual fund returns 10 years of data in India (as of 2026) show equity large-cap funds averaging 10–13% annualised, mid-cap funds 13–17%, and small-cap funds 14–18%. Debt funds have returned 6–8%. Use a mutual fund’s monthly returns calculator to track month-level performance. Past performance does not guarantee future results. Verify at AMFI India.
Disclaimer:
This article is for educational and informational purposes only. It does not constitute financial advice, investment recommendation, or solicitation to buy or sell mutual fund units. Mutual fund investments are subject to market risk. Past performance does not guarantee future returns. Calculator projections are based on assumed constant return rates and do not reflect actual fund performance.
Investors should carefully read all scheme-related documents, consult a SEBI-registered financial advisor, and verify assumptions independently before making any investment decision. Tax treatment mentioned is indicative and subject to change per applicable laws. Please verify current tax rates and regulations at Income Tax India and SEBI.
ARN Disclosure: Investik Future is an AMFI-registered Mutual Fund Distributor. ARN-341107 — Verify on AMFI ↗. Komal Thakur is the content author and digital marketer; the ARN registration belongs to Investik Future, not to the author personally.