
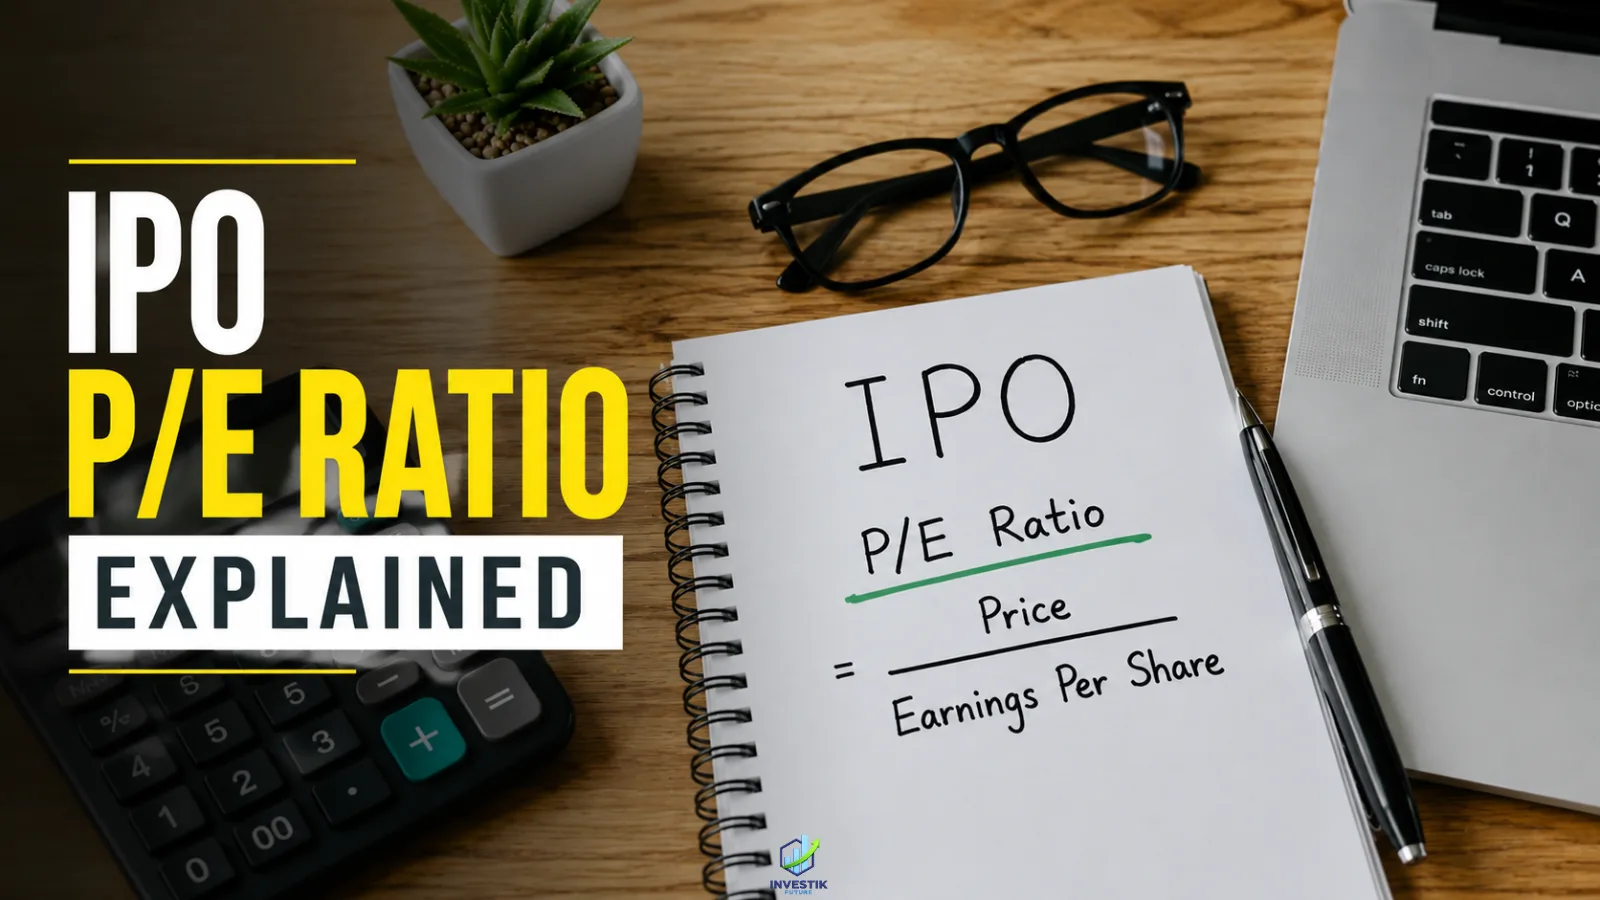

When a company launches an IPO, it asks investors to pay a certain price for its shares. That naturally raises a question: is this price reasonable, or is the company asking for too much?
One of the numbers investors look at to answer this is the price-to-earnings ratio, or P/E ratio. It’s not the only number that matters, but it’s usually one of the first ones people come across while reading an IPO’s financial details.
This article explains what the IPO P/E ratio means, how it’s calculated, how to compare it with similar companies, and why it shouldn’t be used on its own to judge whether an IPO is worth applying for.
What Is the P/E Ratio?
The P/E ratio is a simple way of looking at how much investors are paying for a company’s earnings.
In plain terms: it tells you how much investors are paying for every ₹1 the company earns in a year. If a company’s P/E ratio is 20, it means investors are paying ₹20 for every ₹1 the company earns per share. A higher number usually means investors are paying more for the same ₹1 of earnings, and a lower number means they’re paying less.
How Is an IPO’s P/E Ratio Calculated?
The formula is straightforward:
P/E Ratio = Share Price ÷ Earnings Per Share (EPS)
Here, EPS, or earnings per share, is the company’s profit divided by its total number of shares. It tells you how much profit the company makes for each share that exists.
Let’s use a simple example.
Suppose a company is launching its IPO at a price of ₹200 per share, and its EPS is ₹10.
P/E = ₹200 ÷ ₹10 = 20
This means investors are paying ₹20 for every ₹1 the company earns per share, per year.
What Does an IPO’s P/E Ratio Tell Investors?
On its own, the P/E ratio shows the relationship between the IPO price and the company’s earnings. A few basic patterns are worth knowing:
- If the share price goes up but earnings stay the same, the P/E rises.
- If the share price goes down but earnings stay the same, the P/E falls.
- If earnings go up but the price stays the same, the P/E falls.
- If earnings go down but the price stays the same, the P/E rises.
So the P/E ratio moves whenever either the price or the earnings change. That’s useful to know, but it still doesn’t answer the main question: is this valuation reasonable? For that, the number needs some context.
How to Compare an IPO’s P/E With Its Competitors
This is where the P/E ratio actually becomes useful, and it’s arguably the most important part of understanding it.
A P/E ratio means very little in isolation. A P/E of 20 could look expensive or reasonable depending on what similar companies in the same industry are trading at.
For example, imagine an IPO has a P/E of 20×. Now compare it with a few listed peers in the same sector:
| Company | P/E Ratio |
| IPO Company | 20× |
| Peer A | 16× |
| Peer B | 19× |
| Peer C | 23× |
Looking at this table, the IPO’s P/E of 20× sits roughly in the middle of its peer group, a little higher than Peer A and Peer B, but lower than Peer C. This doesn’t automatically tell you whether the IPO is a good investment. What it does tell you is that the valuation isn’t wildly out of line with similar businesses.
If the same IPO were priced at a P/E of 40× while every peer traded between 15× and 20×, that would be worth a closer look; the market would be paying a much higher premium for this company’s earnings than for comparable ones. The comparison itself doesn’t give you an answer; it just tells you where to focus your attention next.
Is a High P/E Ratio Bad for an IPO?
Not necessarily. A high P/E doesn’t automatically mean an IPO is overpriced.
Sometimes a higher P/E reflects what investors expect from the company going forward — things like:
- Stronger future earnings
- Faster growth compared with peers
- Better profit margins
- A stronger position within its industry
The important thing is to check whether these expectations are actually backed by the company’s financial track record and business outlook, rather than assuming a high P/E is automatically a warning sign.
Is a Low P/E Ratio Always Better?
Also not necessarily. A low P/E doesn’t automatically make an IPO attractive.
A company might have a low P/E because:
- Its earnings are weak
- Growth has slowed down
- The industry it operates in is facing challenges
- Investors have concerns about how the business is run
In short, there’s no single “good” or “bad” P/E number that applies to every IPO. What matters is understanding why the number looks the way it does.
When Can an IPO’s P/E Ratio Be Misleading?
The P/E ratio works best when a company has steady, meaningful earnings. In a few situations, it can give a misleading picture.
Negative earnings. If a company is currently making a loss, its P/E ratio isn’t meaningful at all, since you can’t divide a price by a negative or zero number in any useful way.
One-time profits. If a company’s earnings were unusually high in a particular year because of a one-off event, say, the sale of a property or a tax refund, the P/E ratio can make the company look cheaper than it really is on a normal, ongoing basis.
Cyclical businesses. Some industries, like commodities or capital goods, see profits swing sharply with economic cycles. A P/E ratio calculated during a strong year can look very different from one calculated during a weak year, so it needs to be read carefully.
Rapidly growing companies. A company that’s growing quickly may show a high current P/E simply because investors are pricing in future earnings growth, not just today’s profit.
What Else Should You Check Besides P/E?
P/E is just one piece of the valuation puzzle. Before forming a view on an IPO, it also helps to look at:
- Revenue growth over the past few years
- Profit growth, not just current profit
- Profit margins
- Debt levels
- Return on Equity (ROE)
- Cash flow from operations
- How the company’s valuation compares with listed peers
- What the company plans to do with the IPO proceeds
- The overall growth prospects of the business and industry
None of these numbers work well in isolation. Together, they build a fuller picture than P/E alone ever could.
A Simple Example of Evaluating an IPO Using P/E
Here’s a fictional example that walks through the process from start to finish.
ABC Ltd. IPO
- IPO price: ₹300
- EPS: ₹15
- P/E: 20×
Step 1: Calculate the P/E. ₹300 ÷ ₹15 = 20×
Step 2: Compare it with peers. Say three listed companies in the same industry trade at 15×, 18×, and 24×. ABC Ltd.’s 20× sits within that range, so it isn’t dramatically out of step with the sector.
Step 3: Look at earnings growth. If ABC Ltd.’s profits have grown steadily over the past three years, that offers some support for its valuation. If profits have been flat or declining, the same P/E starts to look less comfortable.
Step 4: Check debt and profitability. A company with manageable debt and healthy margins is generally on firmer footing than one with high borrowings and thin margins, even at a similar P/E.
Step 5: Understand why the company is valued at that level. Putting all of this together, the peer comparison, the earnings trend, and the balance sheet, helps explain why the market might be willing to pay 20× for ABC Ltd.’s earnings.
Notice that at no point does this process end in a “buy” or “avoid” conclusion. The P/E ratio, along with the other checks, simply gives context. The P/E ratio and these other checks help you understand the valuation, but whether an IPO suits you is a separate decision.
What Is a Good P/E Ratio for an IPO?
There’s no universal “ideal” P/E ratio that applies across all IPOs. What counts as reasonable depends on the industry, the company’s growth rate, its profitability, and how its peers are valued.
A P/E that looks high in one industry might be considered normal in another; fast-growing sectors like technology often trade at higher P/E multiples than more mature, stable industries. That’s why comparing an IPO’s P/E with its own peer group, rather than against some fixed benchmark, gives a more meaningful sense of whether the valuation looks reasonable.
Key Takeaway
The P/E ratio tells you how much investors are paying for every ₹1 of a company’s earnings. But that number alone doesn’t tell you whether an IPO’s valuation is expensive or reasonable. To get a clearer picture, it helps to compare the P/E with similar listed companies and look at the business’s growth, profitability, debt, and overall outlook alongside it.





FAQs
What is an IPO P/E ratio?
It's a measure of how much investors are paying for an IPO company's shares relative to its earnings. It's calculated by dividing the IPO price by the company's earnings per share (EPS).
How is an IPO's P/E ratio calculated?
For a simple IPO valuation comparison, the P/E ratio is calculated by dividing the IPO share price by the company's earnings per share (EPS). For example, an IPO priced at ₹200 with an EPS of ₹10 has a P/E ratio of 20.
What does a high P/E ratio mean for an IPO?
It means investors are paying more for each ₹1 of the company's earnings. This can reflect expectations of strong future growth, but it isn't automatically a sign that the IPO is overpriced.
Is a low P/E ratio better for an IPO?
Not always. A low P/E can sometimes reflect weak earnings, slow growth, or concerns about the business, rather than a genuine bargain.
What is a good P/E ratio for an IPO?
No fixed number works for every IPO. It depends on the industry, the company's growth prospects, and how similar listed companies are valued.
ARN Disclosure: Investik Future is an AMFI-registered Mutual Fund Distributor. ARN-341107 — Verify on AMFI ↗. Komal Thakur is the content author and digital marketer; the ARN registration belongs to Investik Future, not to the author personally.