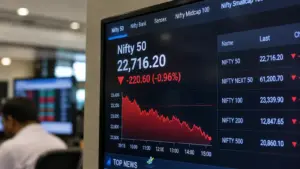


Understanding how the stock market works starts with a simple moment of confusion: you open a stock market app, see a red or green number next to a company name, and have no idea what actually made that number move. That confusion is normal. Most people open a trading account before they understand what happens after they press “buy.”
This guide fixes that. We will walk through how the stock market works end to end: what it actually is, who runs it, how a trade moves from your phone to a company’s ownership register, how prices form, what it costs in tax, and where beginners lose money. By the end, you should be able to open the Investik Future homepage, read any market headline, and know exactly what is being described.
What is the stock market?
A stock market is a regulated marketplace where shares of publicly listed companies change hands between buyers and sellers. When you buy a share of a company, you own a small slice of that business: its profits, its losses, and a portion of any dividend it pays. At its core, this ownership transfer is exactly how the stock market works.
In India, two exchanges handle almost all of this trading: the National Stock Exchange (NSE) and the Bombay Stock Exchange (BSE). Neither exchange owns the shares. Both act as a matching venue, similar to a giant, continuously running auction where millions of buy and sell orders meet every second, which is the clearest single-sentence version of how the stock market works.
The stock market is not one single thing. It is really two connected markets working together, and understanding this split removes most of the confusion beginners have. This two-market structure is the first building block of how the stock market works.
The primary market
This is where a company raises money for the first time by selling shares directly to the public through an Initial Public Offering (IPO). The company gets the cash. Investors get shares. Our detailed guide on how an IPO works covers the application process, allotment, and listing day mechanics in full. The primary market is where the story of how the stock market works usually begins for any company.
The secondary market
Once shares are listed, investors trade them among themselves on the exchange. The company is no longer directly involved. Every time you buy or sell a share of a listed company after its IPO, you are trading in the secondary market. This is what most people mean when they say “the stock market,” and daily secondary-market trading is what most beginners picture when they first ask how the stock market works.
Reading a stock quote
Open any trading app and a stock quote throws several numbers at you at once. Learning to read these numbers is a practical, everyday piece of how the stock market works. Here is what each one means, using a hypothetical stock trading at ₹500:
- LTP (Last Traded Price): The price at which the most recent trade executed, the single most direct signal of how the stock market works at any instant. This is the ₹500 you see on screen.
- Day’s high / low: The highest and lowest price the stock has touched during the current session.
- Open: The first traded price of the day, which can differ from the previous day’s close due to overnight news.
- Previous close: Yesterday’s final traded price, used as the reference point for calculating percentage change.
- Volume: The total number of shares traded so far in the session. Low volume on a price move is a signal to be cautious, since the move may reverse quickly once a larger buyer or seller steps in.
- 52-week high / low: The highest and lowest price over the past year, giving context on whether the current price is near a historical extreme.
- Bid and ask (or buy and sell depth): The 5 best prices at which buyers are willing to buy and sellers are willing to sell, along with the quantity available at each price. This is called market depth and shows you how liquid a stock is at any moment, and watching this depth in real time is one of the clearest windows into how the stock market works minute to minute.
Stock market indices: Nifty 50 and Sensex
You cannot track thousands of listed stocks individually every day, so exchanges publish indices, baskets of selected stocks weighted by market value, to represent the broader market’s direction. Indices are a shortcut for understanding how the stock market works at a glance.
The Nifty 50 tracks the 50 largest and most liquid companies listed on the NSE across sectors. The BSE Sensex tracks 30 major companies listed on the BSE. When a news report says “the market rose 1%,” it almost always means one of these two indices moved by that amount.
Indices matter for 3 practical reasons:
- They give a quick benchmark to compare your own portfolio’s performance against.
- Many mutual funds and Exchange Traded Funds (ETFs) are built to simply track an index rather than pick individual stocks. Our guide on ETFs explains how these low-cost, index-tracking funds work.
- Derivative contracts (futures and options) are written on these indices, and their movement drives a large share of daily trading volume.
Knowing why these indices exist is a small but important part of how the stock market works as a whole.
Market capitalization categories
SEBI classifies listed companies into 3 broad categories based on market capitalization (share price multiplied by total shares outstanding), and this classification shapes both risk and typical return behaviour. Recognising these categories is another piece of how the stock market works that beginners often skip.
| Category | Definition | Typical characteristics |
|---|---|---|
| Large-cap | Top 100 companies by market capitalization | Lower volatility, established businesses, easier to buy and sell in size |
| Mid-cap | Ranked 101st to 250th by market capitalization | Higher growth potential, more price swings than large-caps |
| Small-cap | Ranked 251st onward | Highest growth potential, highest volatility, and often lower liquidity |
A portfolio weighted entirely toward small-caps can swing sharply in a downturn, since these stocks tend to fall further and recover more slowly than large-caps during broad market corrections, another reminder of how the stock market works differently across company sizes. Most financial advisors suggest large-caps form the core of a beginner’s portfolio, with mid-cap and small-cap exposure added gradually as your risk tolerance and research capacity grow.
Dividends, bonus shares, and stock splits
Owning a share does not only mean waiting for the price to rise. Companies return value to shareholders in a few distinct ways.
Dividends are a portion of company profit paid out in cash per share you hold. Not every company pays a dividend; many growth-focused companies reinvest all profit back into the business instead.
Bonus shares are additional free shares issued to existing shareholders in a fixed ratio, such as 1:1, meaning 1 extra share for every share already held. The company’s total value does not change; it is simply divided across more shares, so the price adjusts downward proportionately, an accounting detail that trips up many people new to how the stock market works.
Stock splits divide each existing share into multiple shares, reducing the price per share without changing the total value of your holding. A company might split 1 share of ₹1,000 into 5 shares of ₹200 each, making the stock more accessible to retail investors without changing anything about the underlying business.
None of these events change how much your holding is worth on the day they happen. They change how that value is packaged. Corporate actions like these are a subtle but real part of how the stock market works behind the scenes.
Circuit breakers and trading halts
To prevent panic-driven crashes and manipulation, Indian exchanges use circuit breakers, price bands that pause trading if a stock or the whole market moves too far too fast. These safety mechanisms are built directly into how the stock market works during periods of extreme stress.
Stock-level circuits cap how much an individual stock can move in a single session, typically 2%, 5%, 10%, or 20% depending on the stock’s category and history. Once a stock hits its circuit limit, trading in that stock pauses or is restricted to that band for the rest of the session.
Market-wide circuit breakers apply to the Nifty 50 or Sensex as a whole. A 10%, 15%, or 20% fall from the previous close triggers a trading halt across the entire market for a set duration, giving investors time to absorb information before trading resumes. These have triggered rarely in Indian market history, largely during extreme global shocks.
Foreign and domestic institutional flows
Two categories of large investors move Indian markets more than any single retail investor ever could, and their flows are a major factor in how the stock market works on any given day.
Foreign Institutional Investors (FIIs), now more precisely termed Foreign Portfolio Investors (FPIs), are overseas funds and institutions investing in Indian equities. Their buying and selling is published daily by the exchanges and often explains sudden market-wide moves that have nothing to do with company fundamentals.
Domestic Institutional Investors (DIIs) include Indian mutual funds, insurance companies, and pension funds. Steady monthly SIP inflows into Indian mutual funds have made DII buying a consistent counterbalance to FII selling in recent years, reducing how much foreign outflows alone can drag the market down, a dynamic worth knowing if you want the full picture of how the stock market works today.
Watching net FII and DII activity, published daily on both exchange websites, gives you a read on which side of the market is currently in control, though it should inform context rather than drive individual trade decisions.
The players behind every trade
A single trade you place on your phone passes through several institutions before it settles. Knowing each one removes the mystery of the process and completes the picture of how the stock market works from order to ownership.
| Player | Role |
|---|---|
| SEBI (Securities and Exchange Board of India) | Regulates exchanges, brokers, and listed companies. Sets rules on disclosure, insider trading, and investor protection. |
| Stock Exchanges (NSE, BSE) | Provide the trading platform and match buy and sell orders. |
| Clearing Corporations (NSE Clearing, ICCL) | Act as the counterparty to every trade, guaranteeing settlement even if one side defaults. |
| Depositories (NSDL, CDSL) | Hold your shares in electronic form in your demat account. |
| Stockbrokers | SEBI-registered members who place your orders on the exchange and hold your trading account. |
| Registrar and Transfer Agents (RTAs) | Maintain the official record of who owns how many shares of a company. |
The Securities and Exchange Board of India sets the rulebook every one of these players follows, and its investor education resources are worth bookmarking directly at sebi.gov.in, the primary regulator behind how the stock market works in India.
How to actually start: demat and trading accounts
You cannot buy a share by walking into a bank with cash. Two accounts are required, and beginners often confuse them. Setting these up correctly is the practical starting point for anyone trying to understand how the stock market works in real life.
A demat account holds your shares in electronic form, the way a bank account holds your money. Your shares sit here after purchase, one of the most basic mechanics of how the stock market works for everyday investors.
A trading account is the interface you use to place buy and sell orders on the exchange. Your broker links this to your demat account and your bank account.
Opening both today takes under 15 minutes with a PAN card, Aadhaar-linked mobile number, a cancelled cheque or bank statement, and a webcam selfie for KYC verification. Most brokers complete the process online with no paperwork courier required, which makes the onboarding side of how the stock market works far faster today than it was a decade ago.
Once both accounts are active, you fund your trading account through UPI or net banking, and you are ready to place your first order, the moment where the theory of how the stock market works turns into practice.
Placing an order: what actually happens
Say you want to buy 10 shares of a company trading at ₹500. You open your broker’s app, enter the quantity and price, and hit buy. This five-step sequence is the core mechanical answer to how the stock market works: Here is the sequence that follows:
- Order placement: Your broker’s system sends your order to the exchange (NSE or BSE) instantly.
- Order matching: The exchange’s matching engine looks for a seller willing to sell at your price. If found, the trade executes in milliseconds.
- Trade confirmation: You receive a contract note confirming the price, quantity, and time of execution, your paper trail for how the stock market works on that specific trade.
- Clearing: The clearing corporation calculates the net amount you owe and the net shares you are due, after netting off all your other trades that day.
- Settlement: Funds move out of your bank account and shares move into your demat account.
Understanding settlement cycles
India has moved through several settlement cycles over the past two decades, each one shortening the gap between trade and ownership transfer, and this shortening timeline is itself a good example of how the stock market works evolving over time.
| Cycle | Period used | Meaning |
|---|---|---|
| T+5 | 2001-2002 | Shares settled 5 working days after the trade |
| T+3 | 2002-2003 | Shortened to 3 working days |
| T+2 | 2003-2023 | Global standard for two decades |
| T+1 | Since January 2023 | Mandatory for all equity cash trades; shares credited the next working day |
| T+0 | Optional, expanding since 2024 | Same-day settlement for orders placed before a cut-off time, currently available on the top 500 stocks by market capitalisation |
India adopted T+1 settlement across all listed equities in January 2023, ahead of most developed markets, and continues to expand optional same-day T+0 settlement in phases. If you buy shares under T+1, expect them credited to your demat account the next working day, not instantly, a timing detail worth remembering as part of how the stock market works in practice.
Order types every investor should know
The price you enter changes how, and whether, your order executes, and choosing the right order type is a practical skill tied directly to how the stock market works at the execution level.
- Market order: Executes immediately at the best available price. Fast, but the exact price is not guaranteed.
- Limit order: Executes only at your specified price or better. You control the price; execution is not guaranteed.
- Stop-loss order: Automatically triggers a sell once a stock falls to a set price, capping your downside on a losing position.
- Bracket order: Combines an entry, a target price, and a stop-loss in a single order, common among intraday traders who trade on a fast-moving understanding of how the stock market works.
Beginners should default to limit orders on illiquid or volatile stocks. A market order on a thinly traded small-cap can execute at a price far worse than the last traded price you saw on screen.
What actually moves stock prices
A share price changes purely because of shifting demand and supply at the order level. If more buyers want in at a given price than sellers want out, the price rises until it finds a new balance. The reverse pushes it down. This demand-and-supply mechanism is really the heart of how the stock market works.
Several forces drive that shift in demand and supply:
Company-specific factors: Quarterly results, management changes, new product launches, debt levels, and profit margins all shape whether investors want to hold or exit a stock.
Sector and industry trends: A rate cut can lift banking and housing finance stocks together. A crude oil price spike can hurt airline and paint stocks that depend on oil-linked inputs.
Macroeconomic data: Inflation figures, RBI’s repo rate decisions, GDP growth numbers, and the rupee’s exchange rate against the dollar all shift how attractive Indian equities look relative to fixed deposits, bonds, or gold. You can track official rate and inflation data directly on the Reserve Bank of India’s website, since macro data is a major external input into how the stock market works.
Global cues: US Federal Reserve rate decisions, crude oil prices, and movements in other Asian markets often set the opening tone for Indian indices like the Nifty 50 and Sensex.
Investor sentiment: Fear and greed move prices faster than fundamentals in the short term. A stock can fall on no company-specific news purely because broader market sentiment turned negative, which is why sentiment alone can temporarily override every other factor in how the stock market works.
How an IPO fits into this picture
Before a stock trades on the secondary market, it usually starts with an IPO, and seeing this handoff clearly is essential to understanding how the stock market works from a company’s very first listing day. A private company files a prospectus with SEBI, sets a price band, and opens applications to the public for a fixed window, typically 3 working days. Retail investors can apply through ASBA (Application Supported by Blocked Amount), where your bid amount is blocked in your bank account rather than debited immediately, and released back if you are not allotted shares.
Allotment is not guaranteed even if you apply. Popular IPOs are oversubscribed many times over, and SEBI’s allotment process uses a lottery-style method for retail applicants when demand exceeds supply. Once allotted, shares list on the exchange on a set date, and that listing price is the market’s first real-time verdict on whether the IPO was priced fairly, a moment that shows how the stock market works as a live price-discovery process. Our detailed IPO guide walks through the application steps, allotment mechanics, and what listing-day price moves typically indicate.
Evaluating a company before you buy
Once you move past IPOs and toward picking individual stocks in the secondary market, a short checklist keeps decisions grounded in the business rather than in the stock’s recent price chart. This checklist matters because how the stock market works day to day should never override how a business actually performs:
- Revenue and profit trend over 5 years, not just the latest quarter. One good quarter does not offset a declining multi-year trend.
- Debt-to-equity ratio, which shows how dependent the company is on borrowed money. A high ratio increases risk if interest rates rise or revenue slows.
- Return on Equity (ROE), which measures how efficiently the company turns shareholder money into profit. Our ROE calculator helps you compare this figure across companies you are considering.
- Promoter shareholding and pledging, since a falling promoter stake or heavy share pledging against loans can signal financial stress at the ownership level, even when reported profit looks stable.
- Valuation relative to peers, using ratios like Price-to-Earnings (P/E) and Price-to-Book (P/B) to check whether you are paying a reasonable price for the business, not just a popular one.
None of these numbers guarantees a good outcome on their own. Together, they replace guesswork with a documented reason for owning the stock, which is exactly what lets you stick to a plan when the price moves against you temporarily.
Fundamental analysis vs technical analysis
Investors generally pick one of two lenses, or blend both, to decide what to buy and when, and both lenses look at a different layer of how the stock market works.
| Approach | What it looks at | Best suited for |
|---|---|---|
| Fundamental analysis | Revenue, profit, debt, management quality, competitive position, valuation ratios like P/E and ROE | Long-term investors picking what to buy |
| Technical analysis | Price charts, volume, moving averages, support and resistance levels | Short-term traders deciding when to buy or sell |
If you are building conviction in a company for the long term, understanding Return on Equity matters more than reading a candlestick chart. Our ROE calculator helps you check how efficiently a company turns shareholder capital into profit before you commit money to it.
Direct stocks vs mutual funds: which route fits you
Buying individual shares is not the only way into equity markets, and for most beginners it is not the first step that makes sense. Both routes still depend on how the stock market works underneath, just with a different amount of hands-on involvement.
Direct equity means picking and holding individual company shares yourself. It demands research time, the ability to sit through volatility, and enough capital to diversify across 15 to 20 stocks rather than betting on 2 or 3.
Mutual funds pool money from thousands of investors and are managed by a professional fund manager who picks the underlying stocks. Our complete guide on what a mutual fund is breaks down how these funds are structured and regulated.
Systematic Investment Plans (SIPs) let you invest a fixed amount into a mutual fund every month, smoothing out the effect of market ups and downs over time through rupee cost averaging. Read our breakdown of how SIPs work, and run your own numbers on our SIP calculator before committing to a monthly amount.
A practical starting sequence for most first-time investors: begin with an equity mutual fund SIP to build discipline and diversification, then gradually add direct stock picking once you have researched specific companies you understand well.
Risk management: the part most beginners skip
Picking the right stock matters less than sizing your position correctly. A trader who is right 6 times out of 10 but bets too large on the 4 losing trades still loses money overall. This is one of the harder lessons in how the stock market works: being right is not enough without proper sizing.
A few rules that protect capital over the long run:
- Never put more than 5 to 10% of your portfolio into a single stock, however convinced you are.
- Set a stop-loss before you enter a trade, not after it starts falling.
- Diversify across sectors, not just across company names. Ten stocks in the same sector move together in a downturn.
- Keep an emergency fund separate from your investing capital, so you are never forced to sell equity at a loss to cover an unplanned expense.
Position sizing is the single most underused risk control among retail investors. Our position size calculator lets you work out exactly how many shares to buy based on your account size and how much you are willing to risk on a single trade, before you place the order.
Taxation on stock market gains in India
Every rupee of profit from the stock market is taxable, and the rate depends entirely on how long you held the shares. Understanding this tax layer is just as much a part of how the stock market works as knowing how to place a trade.
Short-term capital gains (STCG)
If you sell listed equity shares within 12 months of buying them, the profit is short-term capital gains, taxed at a flat 20% under Section 111A of the Income Tax Act. This rate applies regardless of your income tax slab, and no basic exemption applies to it, a flat rule that is easy to overlook when you are still learning how the stock market works.
Long-term capital gains (LTCG)
If you hold listed equity shares for more than 12 months before selling, the profit qualifies as long-term capital gains, taxed at 12.5% without indexation. The first ₹1.25 lakh of long-term gains in a financial year is exempt from tax; only the amount above that threshold is taxed. This exemption is one of the more investor-friendly details in how the stock market works from a tax standpoint.
| Holding period | Classification | Tax rate |
|---|---|---|
| Up to 12 months | Short-term (STCG) | 20% flat |
| More than 12 months | Long-term (LTCG) | 12.5% on gains above ₹1.25 lakh per year |
A worked example: You buy shares worth ₹2,00,000 and sell them 14 months later for ₹3,00,000. Your gain is ₹1,00,000, which falls under the LTCG exemption limit, so you pay zero tax on it. If your gain had instead been ₹2,50,000, tax would apply only on the ₹1,25,000 above the exemption, at 12.5%, working out to ₹15,625.
Other rules worth knowing before you sell:
- Securities Transaction Tax (STT) is deducted automatically at the time of every buy and sell transaction on recognised exchanges; you do not pay it separately.
- Dividends are added to your taxable income and taxed at your applicable income tax slab rate.
- Losses can be carried forward. Short-term losses can offset both short-term and long-term gains; long-term losses can only offset long-term gains. Unused losses can be carried forward for 8 assessment years, provided you file your return on time.
- Any capital gains from stocks require filing ITR-2, not ITR-1, even if the gain is small.
Tax rules change with each Union Budget, so cross-check the current thresholds on the Income Tax Department’s official site before filing.
Common mistakes beginners make
Most of these mistakes come from skipping the basics of how the stock market works rather than from bad luck.
Chasing tips without research. A stock recommendation from a social media group or a relative is not a substitute for reading the company’s own financial statements.
Timing the market instead of staying invested. Studies on Indian equity returns consistently show that missing just the 10 best trading days over a decade cuts long-term returns sharply. Time in the market beats timing the market for most retail investors.
Averaging down without checking why the price fell. Buying more of a falling stock only makes sense if the underlying business reason for the fall has not changed. Averaging down on a company with deteriorating fundamentals compounds the loss.
Ignoring liquidity. Small-cap and micro-cap stocks can have very few buyers on the other side. You may struggle to exit at a fair price exactly when you need to.
Trading on margin without understanding leverage. Borrowed money magnifies both gains and losses. A 10% adverse move on a 5x leveraged position wipes out half your capital, not 10% of it.
Skipping the “why” before buying. Before every purchase, write down in one sentence why you are buying this stock and at what price or event you would sell it. If you cannot answer that, you are speculating, not investing.
A practical checklist before you place your first trade
This checklist pulls together the core steps behind how the stock market works into a single, actionable sequence:
- Open a demat and trading account with a SEBI-registered broker.
- Complete your KYC with PAN, Aadhaar, and bank details.
- Decide your starting route: SIP in an equity mutual fund, or direct stock picking, or both.
- Set your position size limit per stock before you start, not after.
- Use limit orders rather than market orders on less liquid stocks.
- Track your holding period against the 12-month LTCG threshold before selling.
- Keep records of every buy and sell for tax filing under ITR-2.
- Revisit your portfolio quarterly, not daily.
Where to go from here
Understanding how the stock market works is the foundation. What you do with that understanding, how much you allocate to equity, how you size each position, and how you plan your tax filing around holding periods, decides whether the market builds wealth for you or simply becomes a source of stress.
Explore our market fundamentals category for more foundational guides, or start comparing specific investment products like equity mutual funds if a fund-based route fits your starting point better than direct stock picking.
Related reading: What is an IPO: meaning, process, and how to invest
FAQs
What happens to my shares if my broker shuts down?
Your shares sit in your demat account with NSDL or CDSL, not with the broker. A broker's closure does not affect your ownership, since the depository, not the broker, holds the legal record of your holdings.
Can I start investing in the stock market with a small amount?
Yes. Many brokers allow you to buy fractional lots or start SIPs in mutual funds with amounts as low as ₹100 to ₹500 a month. Direct stock purchases require enough to buy at least one share plus brokerage.
Do I need a demat account to invest only in mutual funds?
No. Mutual fund units can be held in a non-demat statement of account form directly with the fund house or through platforms that do not require a demat account. A demat account becomes mandatory only for direct equity, ETFs, and certain other listed instruments.
Is the stock market the same as trading?
No. Investing means holding shares for months or years based on business fundamentals. Trading means buying and selling within short windows, from minutes to weeks, based on price movement. Both use the same exchange infrastructure but carry very different risk profiles.
How is a stock market different from a mutual fund?
The stock market is the venue where individual shares trade. A mutual fund is a pooled investment vehicle that itself buys shares (and other securities) on that same market on your behalf, managed by a professional fund manager. This distinction often clears up more confusion about how the stock market works than any other single question.
ARN Disclosure: Investik Future is an AMFI-registered Mutual Fund Distributor. ARN-341107 — Verify on AMFI ↗. Komal Thakur is the content author and digital marketer; the ARN registration belongs to Investik Future, not to the author personally.