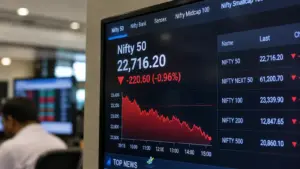


Every stock price on the exchange changes because one thing shifts: the balance between buyers and sellers. What causes stock prices to rise and fall, underneath all the headlines, is that single mechanic playing out through earnings, interest rates, news, and human behavior. This guide walks through every driver in detail, with real numbers, so you understand price movement instead of just reacting to it.
If you’re new to how exchanges work at all, our beginner’s guide to the stock market covers the basics before you dive into this piece. And if you want to track your own portfolio’s average cost as prices move, the stock average calculator on Investik Future does that math for you.
The one rule behind every price move: demand and supply
A stock’s price is not set by a company, a government, or an exchange official. It’s set by an auction. Every second the market is open, buyers submit bids and sellers submit offers, and the exchange’s matching engine pairs them at the price where both sides agree to trade.
When more people want to buy a stock than sell it, buyers start offering higher prices to get filled, and the price rises. When more people want to sell than buy, sellers start cutting their asking price to find a taker, and the price falls. That’s it. Every reason listed in this article earnings, interest rates, war headlines, a CEO’s tweet works only because it changes how many people want to buy or sell at the current price.
Who changes the price of a stock?
No single person sets it. The exchange (NSE or BSE in India, NYSE or Nasdaq in the US, LSE in the UK) runs an order-matching system that continuously pairs bids and offers. Market makers and institutional desks add liquidity so a price exists even when few retail orders are present. Retail investors, mutual funds, foreign institutional investors (FIIs), and algorithmic trading systems all place the orders that move the price. The exchange just enforces the rules and executes the match.
1. Company earnings and financial results
Earnings are the single biggest recurring driver of company-specific price moves. When a company reports quarterly profit, revenue growth, or margins that beat analyst expectations, funds and traders buy in anticipation of higher future value, and the price rises. A miss does the opposite, even if the company is still profitable, because the market prices in expectations, not just current performance.
Three numbers matter most in an earnings report:
- Revenue growth compared to the same quarter last year
- Net profit margin and whether it’s expanding or shrinking
- Forward guidance, meaning what management expects for the next quarter or year
A profitable company can still see its price fall 5 to 10% in a single session if guidance disappoints. This is why earnings day volatility is often larger than the earnings surprise itself would suggest.
2. Interest rates and RBI or Fed policy
Interest rate decisions by the Reserve Bank of India (RBI) or the US Federal Reserve ripple through every stock’s valuation. Higher rates increase the cost of borrowing for companies, reduce consumer spending on credit, and make fixed-income instruments like bonds more attractive relative to equities. This typically pulls money out of stocks and pushes prices down, especially for growth stocks that rely on future earnings.
Lower rates work in reverse. Cheaper borrowing, more disposable income, and less competition from bonds tend to push equity prices up. Rate-sensitive sectors, banking, real estate, auto, and infrastructure, react faster and harder to rate changes than defensive sectors like FMCG or pharma.
You can track RBI’s current policy stance directly on the Reserve Bank of India’s website, which publishes monetary policy committee decisions the same day they’re announced.
3. Inflation and macroeconomic data
Inflation prints, GDP growth numbers, unemployment data, and manufacturing indices (like the PMI) all shift how investors price risk. High inflation erodes future corporate earnings in real terms and often forces central banks toward rate hikes, both of which weigh on stock prices. Slowing inflation with steady growth is usually read as bullish, since it opens room for rate cuts without signalling a weak economy.
4. What makes the price of a stock go up: demand-side triggers
Beyond earnings and macro data, specific demand triggers push a stock’s price up:
- Positive news: new product launches, large contract wins, regulatory approvals, or a favourable court ruling
- Institutional buying: when mutual funds, pension funds, or FIIs increase their holding in a stock, the buying volume itself lifts the price
- Stock buybacks: when a company repurchases its own shares, it reduces the outstanding share count, which increases earnings per share and often signals management confidence
- Index inclusion: when a stock is added to a major index like the Nifty 50 or Sensex, index funds are forced to buy it, creating sustained demand
- Short covering: when traders who had bet against a stock (short sellers) are forced to buy shares to close their position, adding sudden buying pressure
5. What causes stock prices to fall: supply-side triggers
The mirror image applies on the way down:
- Negative earnings surprises or profit warnings
- Regulatory action, such as a SEBI investigation or a fine
- Promoter or institutional selling, especially large block deals
- Index exclusion, which forces index funds to sell
- Panic selling during market-wide corrections, where investors sell fundamentally sound stocks simply because the broader market is falling
- Debt downgrades by rating agencies like CRISIL or ICRA, which raise a company’s borrowing costs and signal financial stress
6. Market sentiment and investor psychology
Prices don’t move on facts alone. They move on how investors feel about those facts. This is why the same earnings report can send one stock up 8% and a similar report send another stock down 3%, depending on what was already priced in and how the broader mood sits.
Two recurring psychological patterns matter here:
Herd behaviour: When investors see a stock or sector rallying, many buy simply because others are buying, not because they’ve independently verified the value. This amplifies moves in both directions and is a major reason bubbles form and later correct sharply.
Fear and greed cycles: During strong rallies, greed pushes valuations beyond what fundamentals support. During sharp declines, fear pushes prices below fair value as investors sell to avoid further loss. Neither extreme reflects the company’s actual business performance.
Understanding this difference between a company’s bull market versus bear market behaviour helps you separate a genuine trend from a sentiment-driven overreaction.
7. Foreign institutional investor (FII) and domestic institutional investor (DII) flows
In India specifically, FII and DII flows move the Nifty and Sensex more than almost any other single factor on a day-to-day basis. FIIs bring large pools of foreign capital, and when they buy heavily, the market tends to rally broadly, especially in large-cap stocks. When FIIs pull money out, often in response to a stronger US dollar or rising US Treasury yields, Indian markets can fall even without any bad domestic news. DII flows, largely from mutual funds and insurance companies, have grown substantially and now often cushion the market against FII selling.
How is stock price determined in real time?
During market hours, price discovery happens through continuous order matching. Every buy and sell order sits in the exchange’s order book, sorted by price and time priority. When a buyer’s bid price matches a seller’s ask price, the trade executes at that price, and that becomes the stock’s last traded price (LTP), updated in real time on every trading terminal and app.
The bid-ask spread, the gap between the highest price a buyer is offering and the lowest price a seller will accept, narrows in liquid, high-volume stocks and widens in illiquid ones. Wider spreads mean more price uncertainty and higher transaction costs for the investor.
Understanding how to read a stock chart helps you see this real-time price discovery visually, through candlesticks, volume bars, and support and resistance levels.
Why do stock prices change when the market is closed?
Indian markets close at 3:30 PM IST, but the underlying company doesn’t stop existing, and neither does global news. Prices still shift after close for several reasons:
- After-hours and pre-market sessions: NSE and BSE run limited pre-open sessions (9:00 to 9:15 AM) that establish an equilibrium price based on orders placed before the market fully opens.
- Global cues: US markets close well after Indian markets, so overnight moves on Wall Street directly shape how Indian stocks open the next day.
- GIFT Nifty (formerly SGX Nifty): This derivative contract trades nearly 24 hours and gives a live signal of where Nifty is likely to open, reflecting global sentiment that built up while Indian markets were shut.
- Corporate announcements after market hours: Companies often release results, resignations, or major contracts after 3:30 PM specifically to let the market digest the news before the next session, which is exactly why stocks can gap up or down sharply at the next day’s open.
Does the stock market always go up in the long term?
Historically, broad equity indices have trended upward over multi-decade periods, but not in a straight line and not for every stock. The Sensex has moved from under 1,000 in the early 1980s to well above 80,000 by 2026, a multi-decade compounding story built on India’s GDP growth, corporate earnings growth, and rising retail participation. But this long-term trend includes multiple periods of 40 to 60% drawdowns, including 2008 and 2020, each followed by recoveries that took months to a few years.
The distinction that matters: the market’s long-term direction is a statement about broad, diversified indices over long holding periods, not a guarantee for any individual stock or any given year. Individual companies can and do go to zero, through bankruptcy, fraud, or being outcompeted. This is exactly why diversification across the stock exchange’s listed universe, rather than concentrated single-stock bets, is the core principle behind most long-term wealth-building strategies.
Technical factors that move price in the short term
Beyond fundamentals and sentiment, mechanical trading factors shift prices in ways that have nothing to do with a company’s business:
- Support and resistance levels: Prices often pause or reverse at levels where past buying or selling was concentrated, because traders place orders around these historical points.
- Trading volume: A price move on low volume is generally considered weaker and more reversible than the same move on high volume.
- Circuit breakers: Indian exchanges halt trading in a stock (or the entire market) if the price moves beyond a preset band, typically 5%, 10%, or 20% depending on the stock, to prevent panic-driven crashes. NSE publishes its current circuit filter rules on the official NSE India website.
- Algorithmic and high-frequency trading: A large share of daily volume on Indian exchanges now comes from algorithms reacting to price patterns in milliseconds, which can amplify short-term swings in either direction.
- Order types: The kind of order placed, market, limit, or stop-loss, affects how aggressively a trade fills and how much it moves the price. Our guide to types of orders in stock trading breaks down how each one behaves differently during volatile sessions.
The tax and regulatory layer behind every price move
Regulation shapes how investors behave around price swings, which in turn shapes the price itself. Two rules matter most for anyone trading Indian equities in 2026:
Securities Transaction Tax (STT): Charged on every delivery-based equity trade at 0.1% on both the buy and sell side. If you buy shares worth ₹1,00,000, you pay ₹100 in STT on that purchase alone, and another ₹100 (adjusted for the sale value) when you sell.
Capital gains tax: Long-term capital gains (holding period over 12 months) on listed equity shares are taxed at 12.5%, with the first ₹1.25 lakh of gains in a financial year fully exempt. Short-term capital gains (under 12 months) are taxed at 20%. Neither STT paid nor the LTCG exemption can be claimed as a separate deduction elsewhere; they apply independently.
SEBI regulates disclosure requirements, insider trading rules, and circuit breaker mechanisms that directly shape how information reaches the market and how violently prices can move on that information. You can check current SEBI circulars on the official SEBI website.
Common mistakes investors make when prices swing
- Selling in panic during a correction without checking whether the company’s fundamentals actually changed.
- Chasing a stock after a sharp rally, buying at the top of a sentiment-driven spike rather than on fundamentals.
- Ignoring volume and treating every price move as equally meaningful.
- Confusing a single stock’s crash with a market-wide crash, and exiting a diversified portfolio because of one bad holding.
- Not distinguishing short-term volatility from long-term compounding, which leads to abandoning a sound long-term plan over a bad quarter.
A practical checklist before you react to a price move
- Check whether the move is stock-specific or market-wide (look at the Nifty or Sensex move, not just your stock).
- Read the actual news or earnings report before assuming the reason.
- Check trading volume alongside the price change.
- Confirm whether the move is within a normal daily range or has triggered a circuit filter.
- Review your original investment thesis: has the company’s business actually changed, or just its price?
Quick comparison: short-term trader vs long-term investor reaction
| Factor | Short-term trader | Long-term investor |
|---|---|---|
| Reacts to | Daily volume, technical levels, news headlines | Quarterly and annual earnings trends |
| Typical holding period | Minutes to weeks | 1 year or more |
| Tax treatment (India) | STCG at 20% | LTCG at 12.5% above ₹1.25 lakh exemption |
| Main risk | Whipsaws from sentiment and algorithms | Company-specific business risk over years |
| Best tool | Order types, stop-loss, chart patterns | Fundamental analysis, portfolio diversification |
Conclusion
What causes stock prices to rise and fall comes down to one mechanism, the constant negotiation between buyers and sellers, driven by earnings, interest rates, macro data, institutional flows, sentiment, and short-term technical factors. None of these forces works in isolation. A rate hike matters because it changes how investors value future earnings. A great earnings report matters because it shifts how many buyers show up the next morning. Once you can trace a price move back to which of these forces caused it, daily volatility stops feeling random and starts looking like a pattern you can actually read.
For more on the mechanics behind these moves, our stock market category page has further guides on reading charts, order types, and market structure.
ARN Disclosure: Investik Future is an AMFI-registered Mutual Fund Distributor. ARN-341107 — Verify on AMFI ↗. Komal Thakur is the content author and digital marketer; the ARN registration belongs to Investik Future, not to the author personally.